
Software for
Oil & Gas Prospects, Projects
& Portfolios
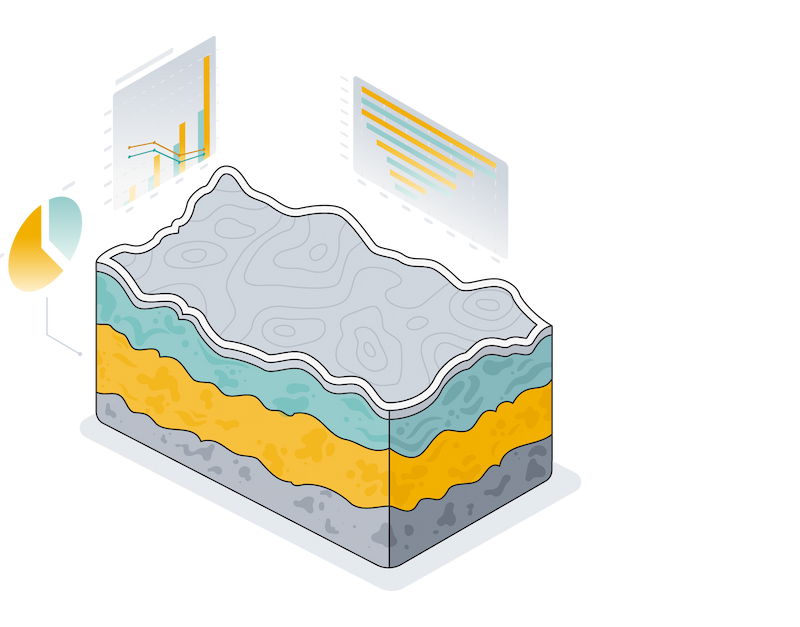
Our software solutions seamlessly integrate Rose course concepts, leveraging the analysis of uncertainty for resource estimation, aggregation, and cash flow modeling. With clear visibility from data inputs to calculated outputs and charts, our software facilitates resource and chance of success and value estimation, ensures quality control and consistent communication, and preserves the integrity of the risk analysis implementation process.

We empower companies to strategically incorporate risk and uncertainty analysis principles into their evaluations of prospects, plays, and portfolios.
Geo Risk Analysis Studio for O&G
O&G RESOURCES AND CHANCE ASSESSMENT
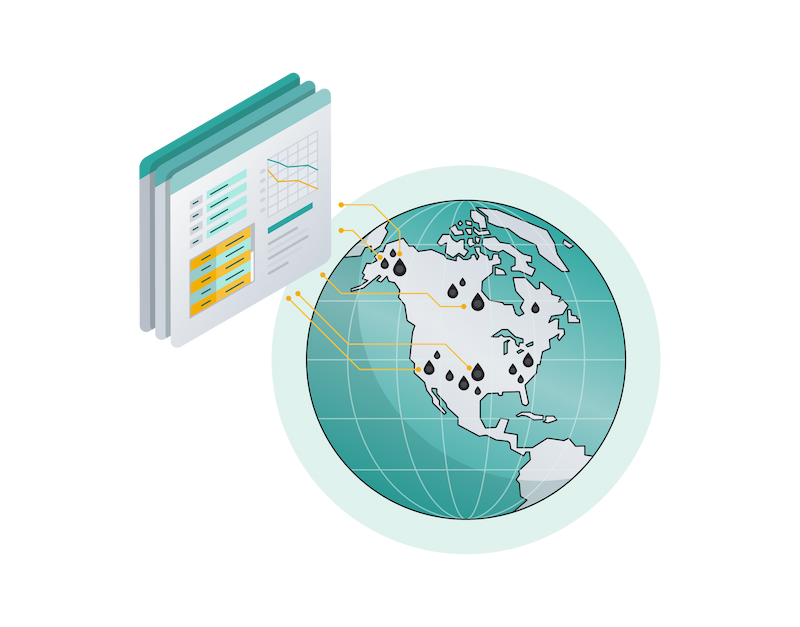
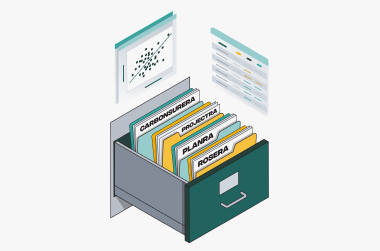
PlanRA
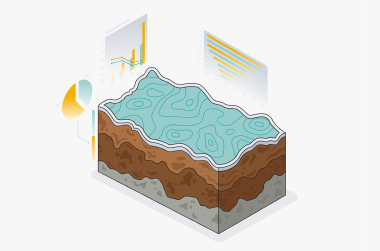
Analyze and select the drilling portfolio to best deliver your targets for value creation through resource discoveries
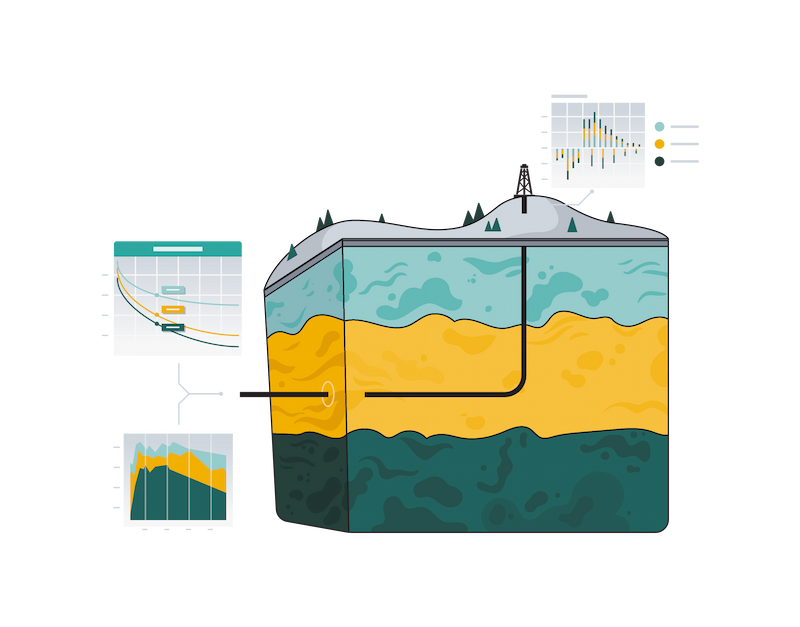
ProjectRA
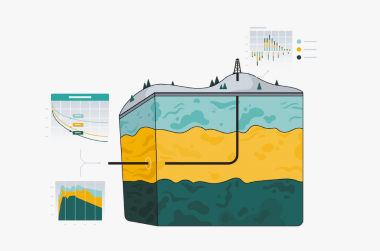
Probabilistic modeling of production, cash flow, and economic metrics
SUPPORTING SOFTWARE
01
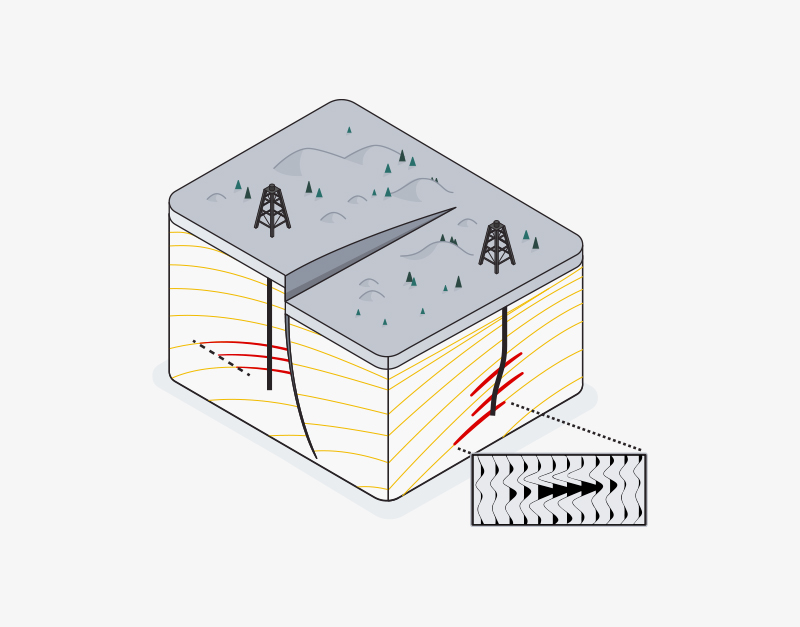
SaRA
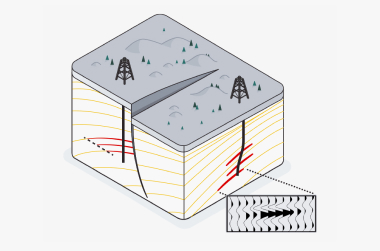
Implement a systematic and consistent grading of seismic amplitude anomalies to modify the chance of success.
02
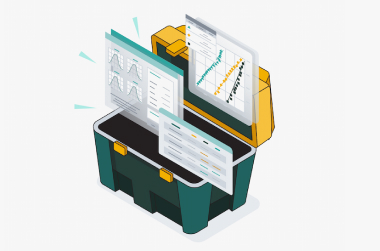
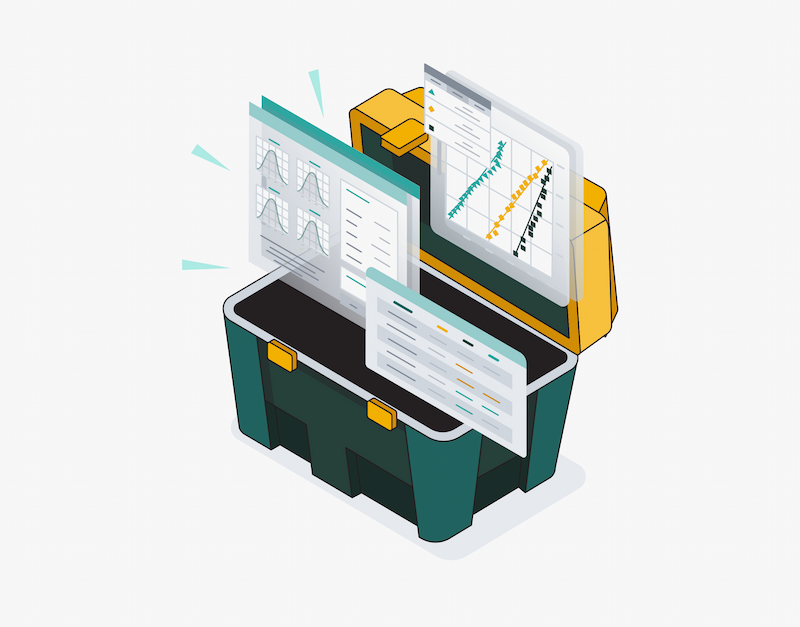
ToolboxRA
Apply powerful curve fitting techniques to analog data for building input distributions. Use handy calculators to support resource, chance, and value assessments.


Get familiar with rose software
After you have licensed and installed the Rose software onto your company’s network, remember that we offer training courses for all of our software.

Software tools for results
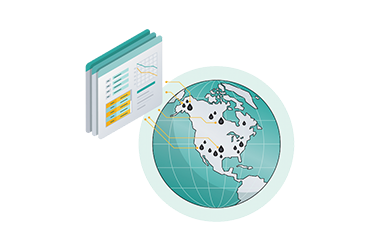
Our software tools help companies deal with risk and uncertainty and support effective decision-making in many types of projects including:
- Conventional Oil & Gas (Offshore and Onshore)
- Unconventional Shale and Tight Reservoir Oil & Gas
- CO₂ Sequestration/Carbon Capture and Storage
- Helium Exploration & Production
- Midstream Gas
1
01
Request a Demo
Discover the features and advantages of our software by requesting a personalized demo.
02
Open Enrollment
Our open enrollment courses offer individuals and smaller companies access to our industry-leading trainings. Courses are available worldwide throughout the year.
03
Interested in Learning More?
Please fill our our request information form to determine availability and pricing. Someone will respond within 24 hours.