
PlanRA
Risk Analysis That Enhances Your Exploration Metrics
Analyze and select the drilling portfolio to best deliver your targets for value creation through resource discoveries.
Key Advantages
Aggregate Resources, Value and Chance
- Import RoseRA or other tools’ prospect resources and chance including multiple zone aggregates
- Simulate probabilistic exploration costs, success case value, and monthly production rates
- Rank prospects based on multiple criteria
- Compare alternate portfolios on multiple metrics and goals
- Model hub/clusters with chance dependency, commercial thresholds and Dry Hole Tolerance
01
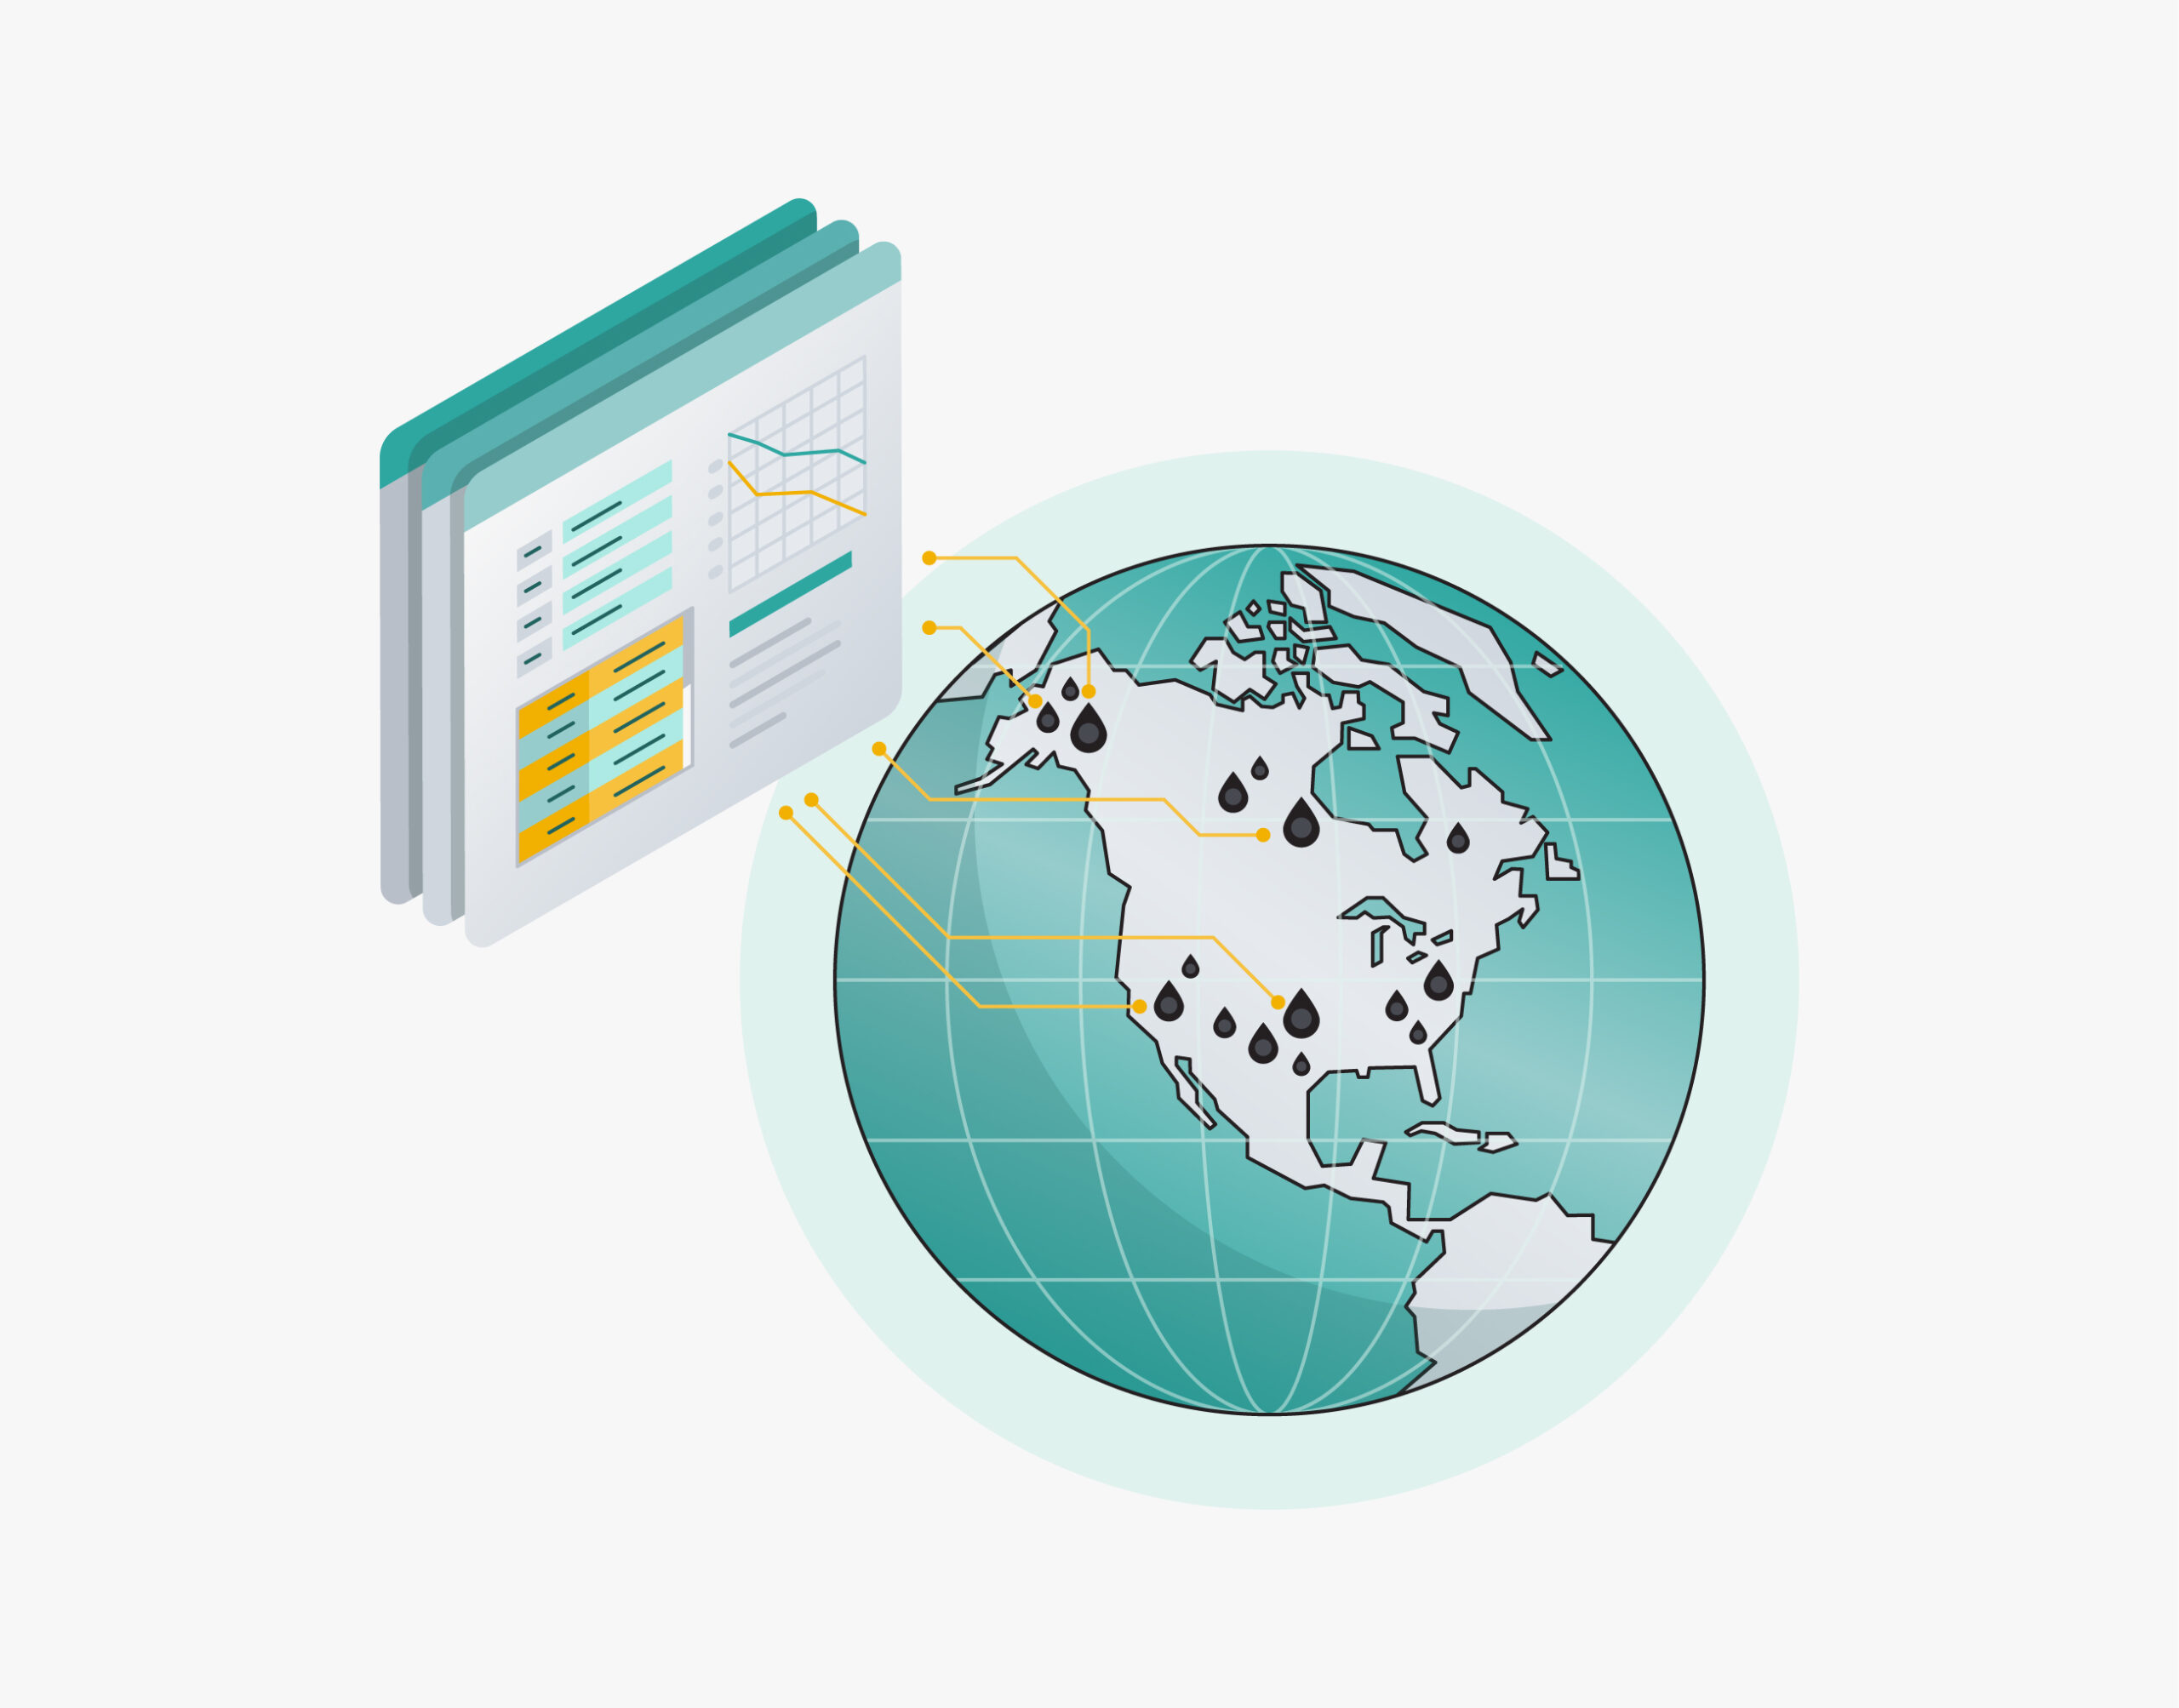
Purpose
PlanRA aggregates selected prospects to show the range of possible outcomes for resources, exploration costs, and value.
02
Prospect Database
Prospects can be bulk loaded into PlanRA from RoseRA or other prospect evaluation software. Additional information including metadata, costs, value and monthly production and can be optionally added. The Build and Manage function enables the selection of prospects on a wide range of descriptive and numerical criteria for evaluation in a portfolio.
03
Portfolio Evaluation
Modeled prospects can be evaluated on multiple criteria including geologic and commercial resources, costs, value, predicted number of geologic and commercial discoveries, and time series outputs for key metrics.
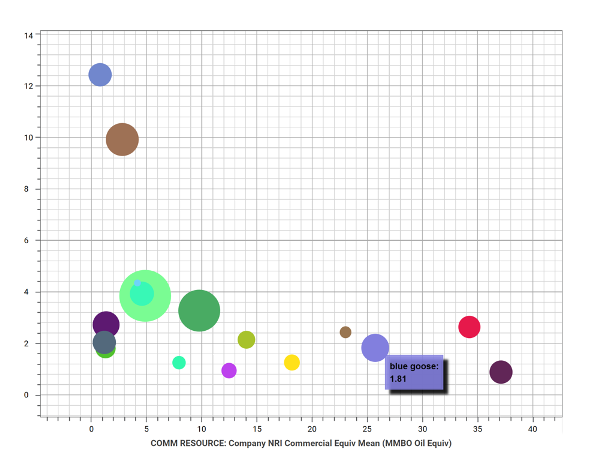
Compare prospects on Cross Plots with over 100 metrics
Prospect Ranking and Characterization
Prospect Cross Plots and Ordinal Ranking charts allow you to compare prospects within the portfolio and to easily spot biased prospect estimates for further review. Over 100 prospect metrics are available from convenient drop-down lists including resources, chance of success, costs and value.
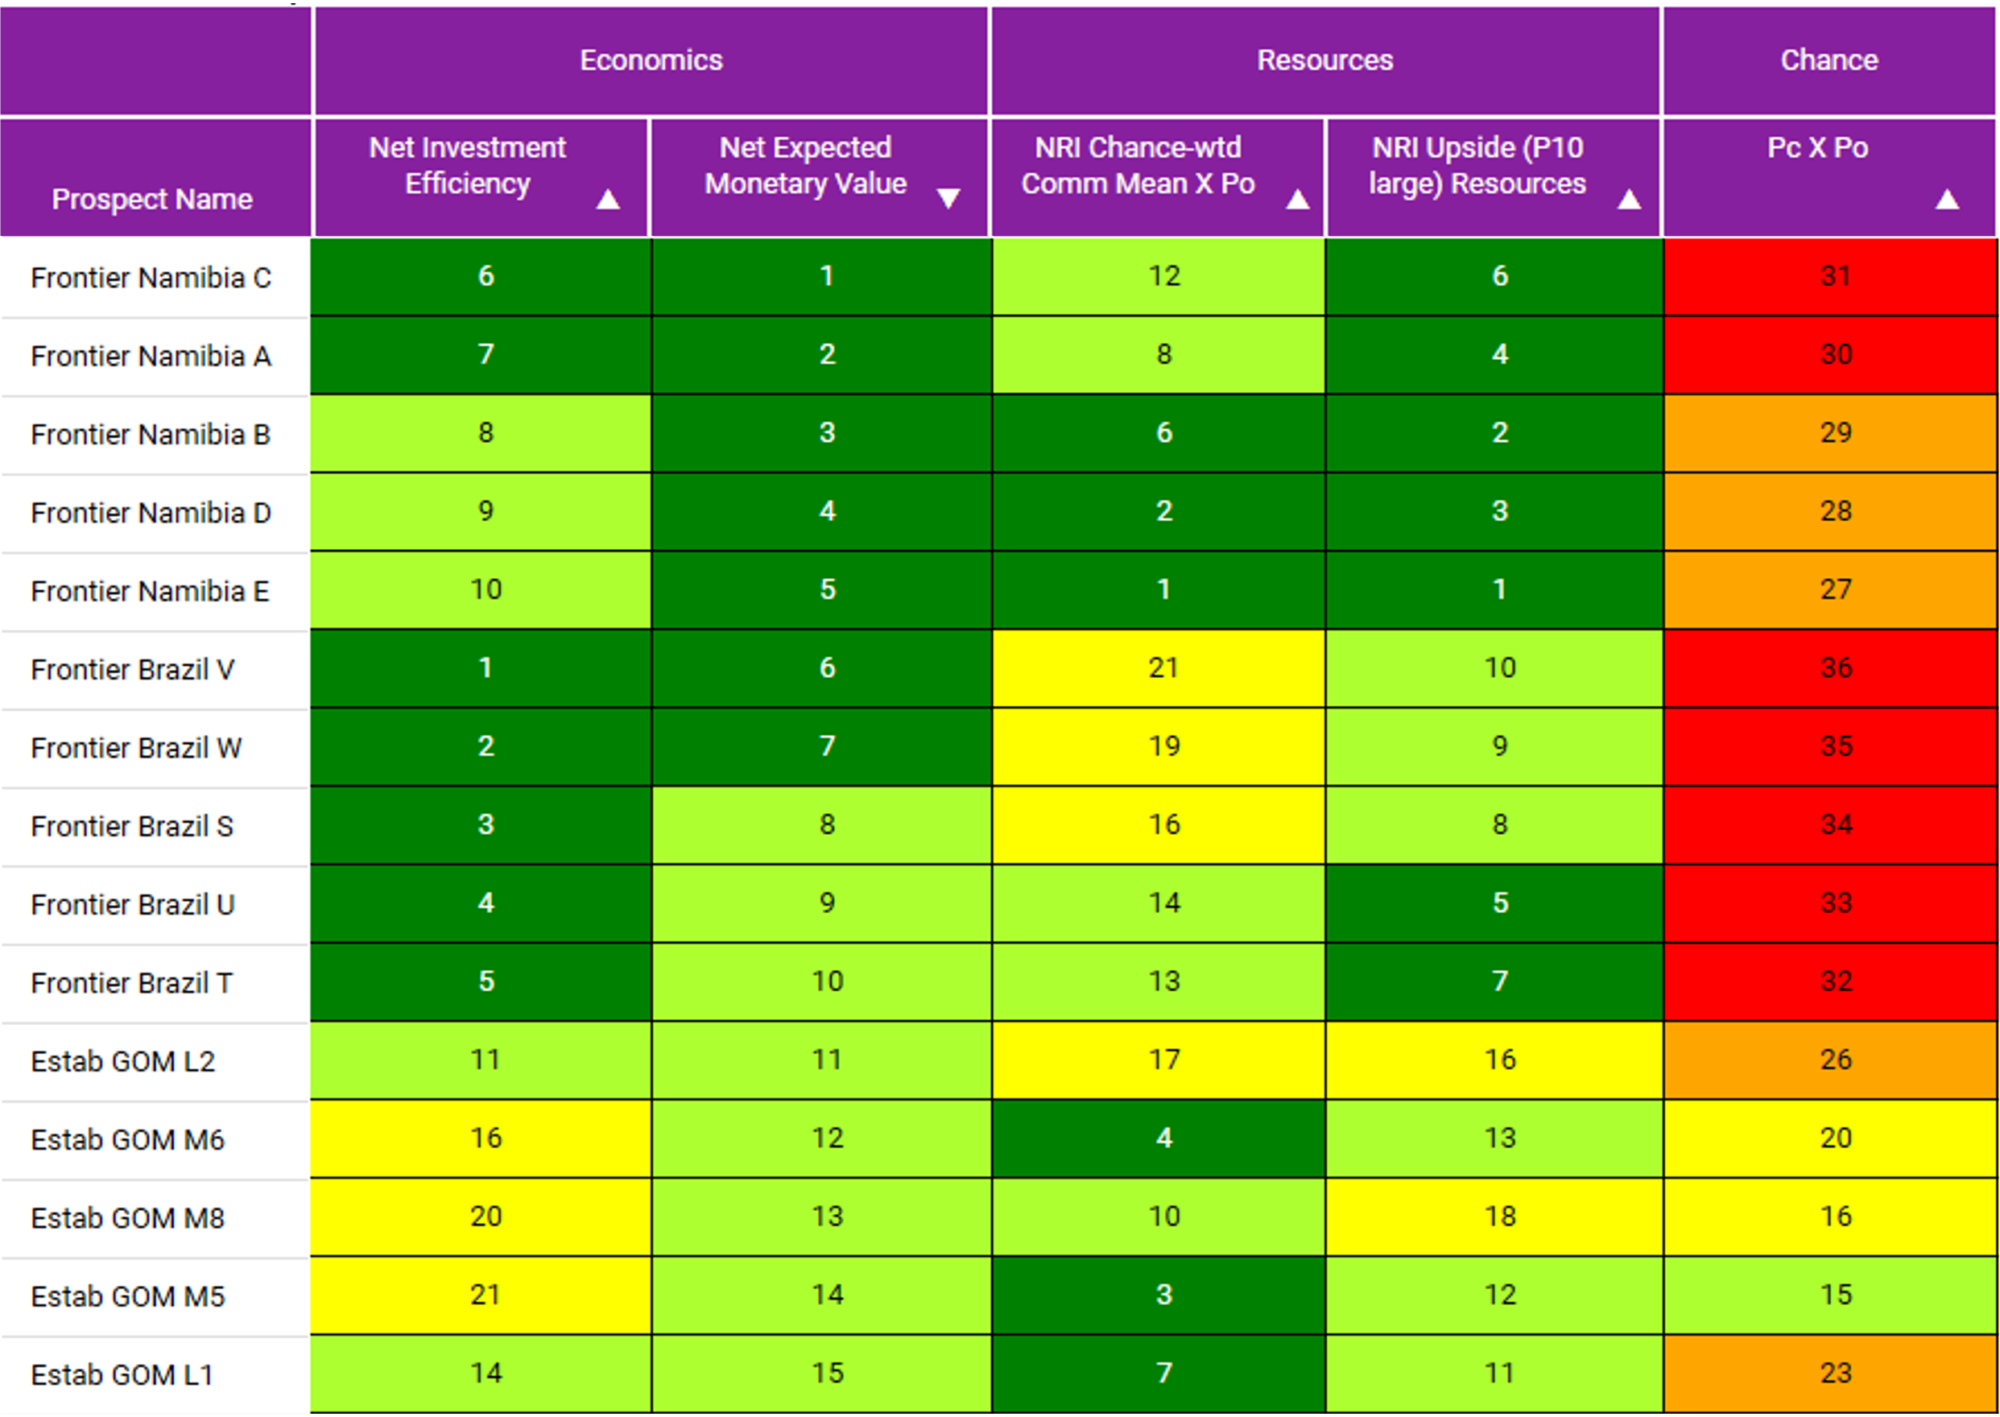
Traffic Light Matrix ranking prospects
TRAFFIC LIGHTS
Use the Traffic Lights matrix to rank prospects from best to worst based on goals of maximizing value, resources, or number of discoveries to help define the best prospects for drilling and their drill order.
HUBS & CLUSTERS
Group related prospects and quantify their degree of shared chance dependence at the component to define the group’s Shared Chance and each prospect’s conditional Local Chance. Honor user-selected Shared and Local Dry Hole Tolerances and Group Commercial Thresholds in the simulation. Minimize drilling expenses by stopping drilling when the petroleum system for a group fails.
PORTFOLIO PERFORMANCE TRACKING
Once the portfolio plan is defined, Pre-Drill (P10, P50, P90, Mean) forecasts for cumulative resources and number of discoveries can be tracked versus actual results using Sequential Aggregation charts.
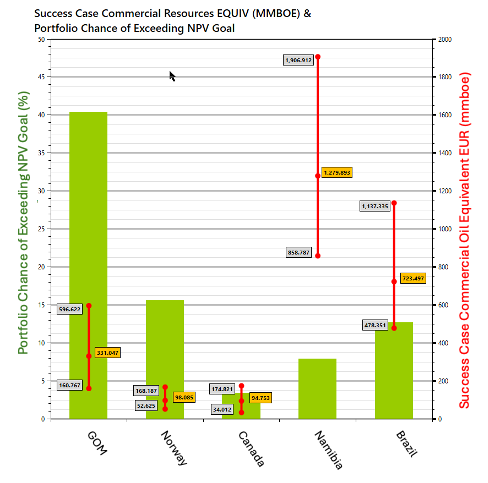
Compare predicted deliverables for named portfolios to select the best portfolio to meet company goals
Portfolio Comparisons
Alternate portfolios can be compared on many metrics and charts such as the probability of attaining resource and value goals while honoring any capital constraints.
Efficiency chart showing EMV Goal with prospects sorted minimizing emissions
Model CO2 Emissions and Injected CO2 Sequestration Mass
PlanRA allows the capture of the range of Scope 1, 2 and 3 CO2 emissions related to opportunities characterized in the portfolio. CO2 sequestration opportunities. The value created from their injected CO2 mass can be modeled and simulated to offset emissions. Build a custom ranking utilizing the Prospect Ranking functions to maximize on financial and resource metrics while minimizing emissions.
1
01
Request a Trial
Discover the features and advantages of our software by requesting a personalized demo.
02
Open Enrollment
Global Open Enrollment courses offer individuals the opportunity to access valuable information, similar to In-House courses for larger firms. Courses are available worldwide throughout the year.
03
Interested in Learning More?
Please fill our our request information form to determine availability and pricing. Someone will respond within 24 hours.