
ToolboxRA
Interrogate Your Analog Data to Make Better Resource Assessments!
ToolboxRA provides an easy and intuitive application for analyzing analog data and improving your uncertainty estimates for exploration and development resource and chance of success estimation.

Tools Included
- Enhanced Plotting and Curve Fitting to Analog Data
- Methods for building Lognormal, Beta, and Normal Distributions based on a minimal number of inputs
- Chance of Success and Dry Hole Analysis Tools
- Gas Expansion Factors, Oil Formation Volume Factors and Condensate Shrinkage calculators
- Creaming Curves
- Ternary Plot function
- Analyze all input and output detail from multiple files to assist with quality control and reality checking
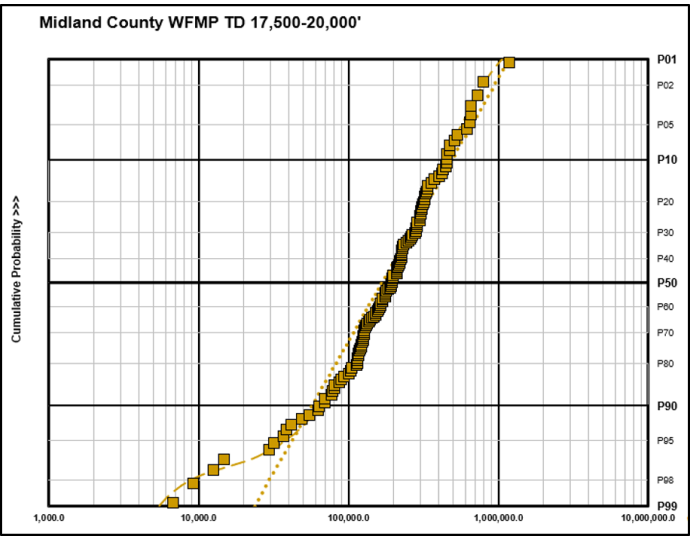
ENHANCED PLOTTING AND CURVE FITTING
This function allows users to understand the appropriate input distribution from analog data sets for resource assessment. ToolboxRA provides an Enhanced Plotting function to evaluate lognormal, beta, normal and polynomial curve fits to determine the best distribution shape for characterization for characterization in RoseRA and ProjectRA. Key analog wells can be highlighted to assist with reviewing the analog data sets with management.
OTHER FEATURES
tools to position companies for future growth
Chance of Success and Dry Hole Analysis
Gain insight into the uncertainty of chance based on the historical number of successful and failed wells for a play. The chance uncertainty is greater with fewer wells and narrows as more wells are included.
Understand and model the Gambler’s Ruin probability (all wells are dry) and the likely number of discoveries given an average chance for your drilling program.
QC of the Prospect Inventory
Extract key rock volume and hydrocarbon yield data for a multitude of prospects to inspect and reality check the estimates used to calculate the volumetrics. Quickly identifying potentially biased estimates ensures consistency and helps remove any biases from the prospect database. Crossplots of any key quantitative and qualitative attributes for multiple prospects can be charted to identify more favorable opportunities and outliers.
Creaming Curves
Creaming Curves plot discoveries in chronological order to evaluate the maturity of a play or basin.
Ternary Plots
Explore three component variables using the Ternary Plot to understand each component’s contribution to the total. For example, easily visualize the quartz, clay and carbonate percentages of shale to compare productivity based on fracturing and stimulation viability.
1
01
Request a Trial
Discover the features and advantages of our software by requesting a personalized demo.
02
Open Enrollment
Our open enrollment courses offer individuals and smaller companies access to our industry-leading trainings. Courses are available worldwide throughout the year.
03
Interested in Learning More?
Please fill our our request information form to determine availability and pricing. Someone will respond within 24 hours.