A summary table reveals all the inputs and results. Using powerful filtering tools, individual trials can be selected and displayed to observe the production, capital, investment streams and economic metrics. These can be used to communicate potential development scenarios and cash-flows for planning or portfolio analysis.
ProjectRA
Probabilistic Production, Cash Flow and Economic Metrics, Unconventional, Conventional, Midstream, A&D, CCS, and Helium
ProjectRA effectively models the impact of uncertainty on project economics in the type curve, costs, timing, and intensity of activities related to the staged evaluation of a project.
- Complete project evaluation tool – from scoping and development through execution
- Evaluate multiple play segments (zones, benches, or areas of interest) in a single project
- Built-in tools to facilitate forecasting from limited datasets
- Pilot design to evaluate the trade-off between confidence in a successful program and capital spent
- Optimize assets and the scheduling of well completion with respect to facility size (existing or planned)
- Evaluate actual performance of a modeled project through sequential aggregation
PLAY SEGMENTS
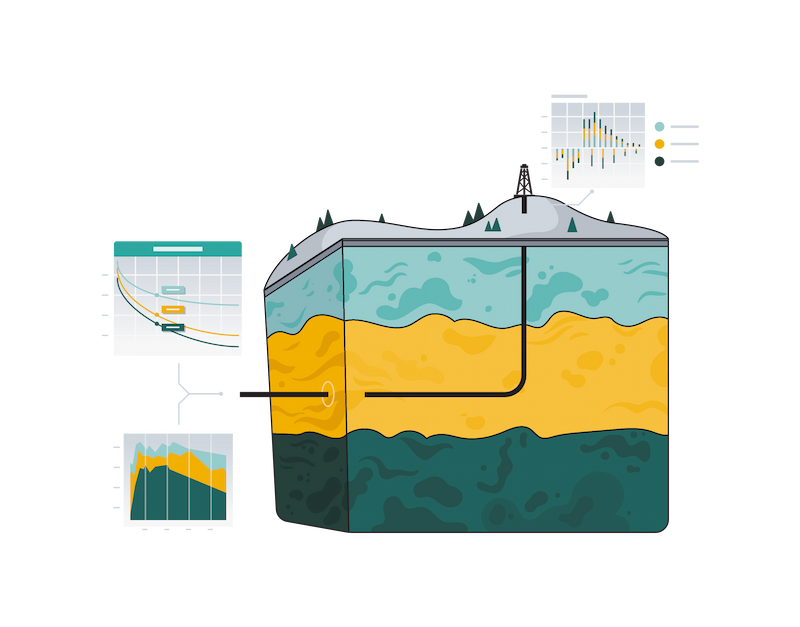
The basic unit of evaluation is the Play Segment where key production and capex inputs vary either spatially or stratigraphically. Projects can be modeled with an unlimited number of play segments. Results from the resource assessment and cash flow are output for both individual segments and the project aggregate. This rapidly helps identify which areas of the project should be pursued, reevaluated, or divested.
STAGED INVESTMENTS
After each segment is defined, the possible stages to include in the evaluation are:
Discovery tests whether the petroleum system is viable and potentially material. Shared Chance is modeled via a customizable checklist.
Deliverability (Appraisal) tests the project against a minimum average IP rate required for a given number of wells.
Demonstration (Pilot) tests a defined number of wells to demonstrate commercial viability
Development drills the wells in your acreage tracts at your specified spacing.
3-Stage gate outputs to ‘fail-early’ and minimize capital at risk
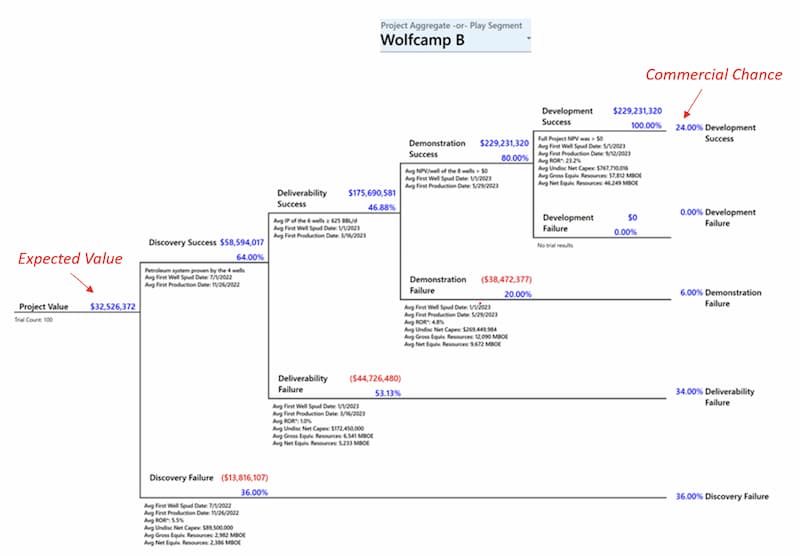
DECISION TREE OUTPUT
Simulation results are presented in both deterministic and probabilistic form. A decision tree provides insights into the chance of success for the overall project and in which stages play segments fail so that additional drilling is stopped. Other probabilistic outputs include a dashboard of project metrics at the project, play segment and well levels. These include resources, NPV (Net Present Value) and detailed CAPEX, OPEX etc. for all trials.
Flexible type curve modeling options or use analog imports with uncertainty for production forecasting
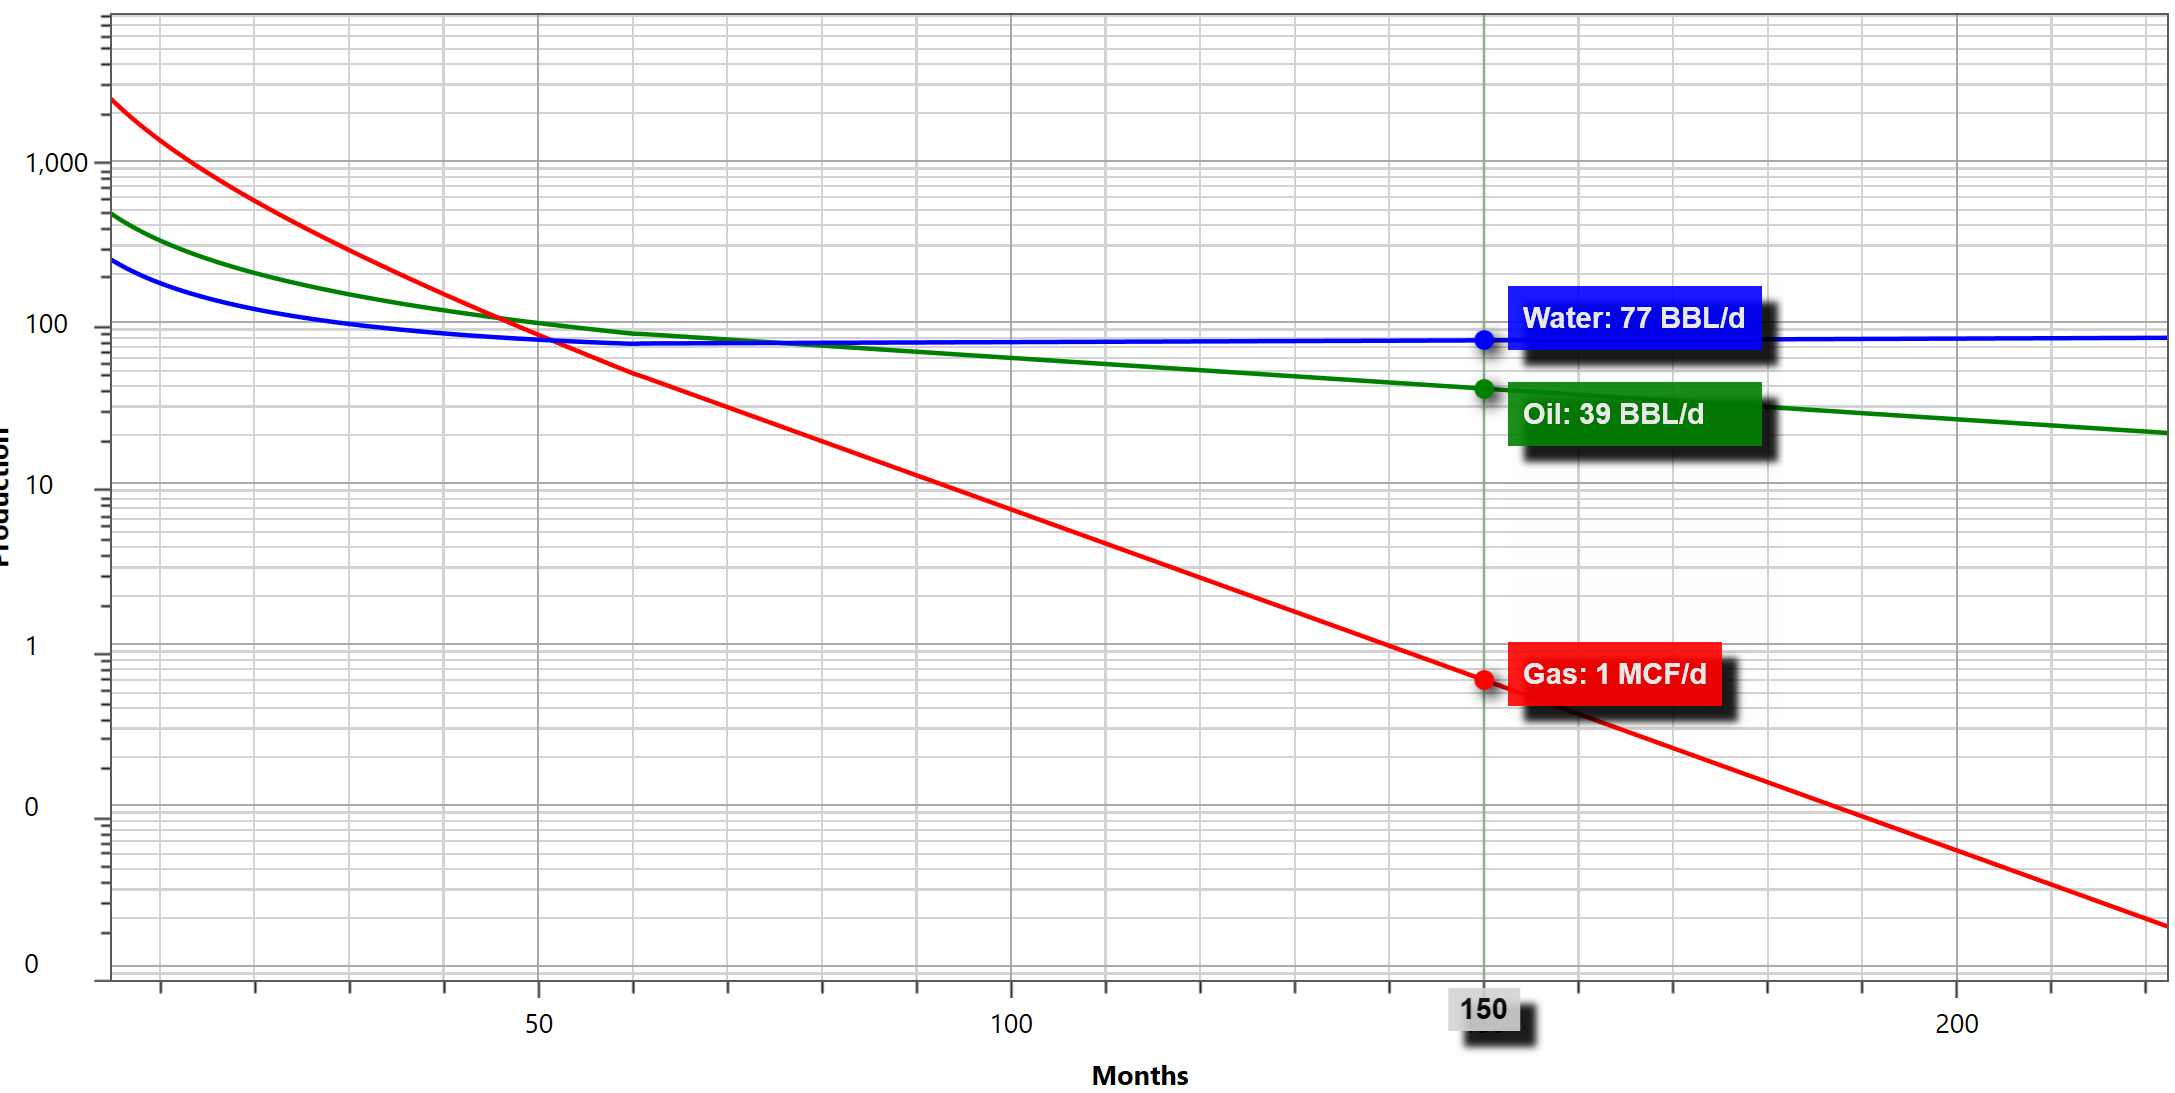
FLEXIBLE TYPE CURVE MODELING
ProjectRA provides numerous ways to build type curves. You can construct them using empirical methods or import them from database analogs or reservoir simulators. An EUR (Estimated Ultimate Recovery) per well simulator models the range of uncertainty on a per well basis from the type curve inputs for all the modeled products. GOR can be modeled to vary through time.
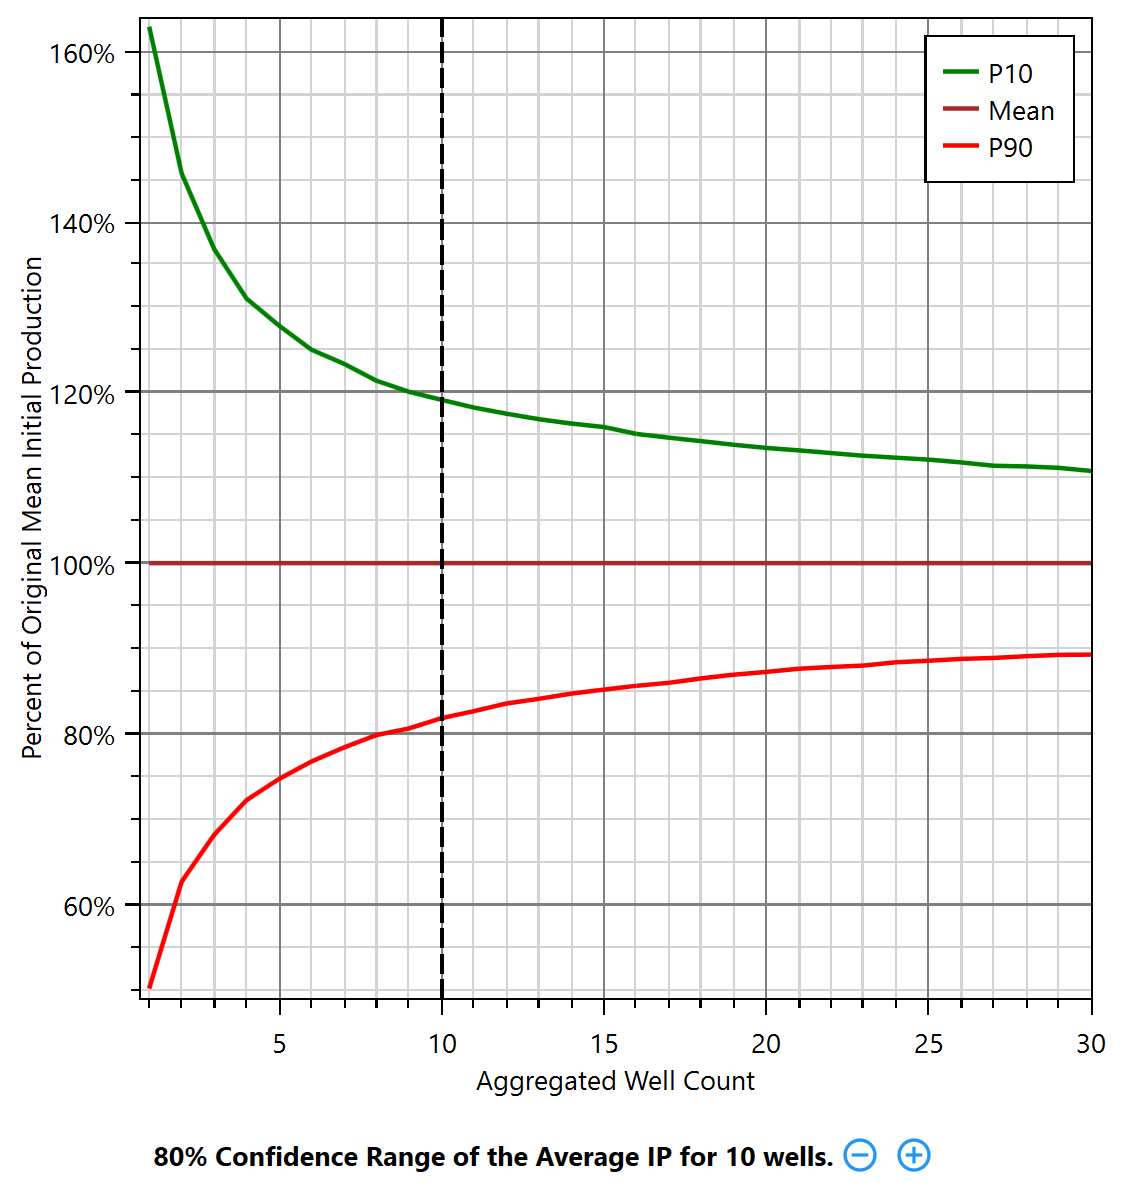
Trumpet Plot showing the 80% confidence range of the average IP for a 10 well program
TRUMPET PLOTS AND CONFIDENCE CURVES
Trumpet Plots are used to characterize the irreducible uncertainty of what the mean initial production rate will be when forecasting from existing wells or analogs. Confidence curves are used to estimate the required number of wells needed to achieve a given level of confidence that some threshold rates can be exceeded.
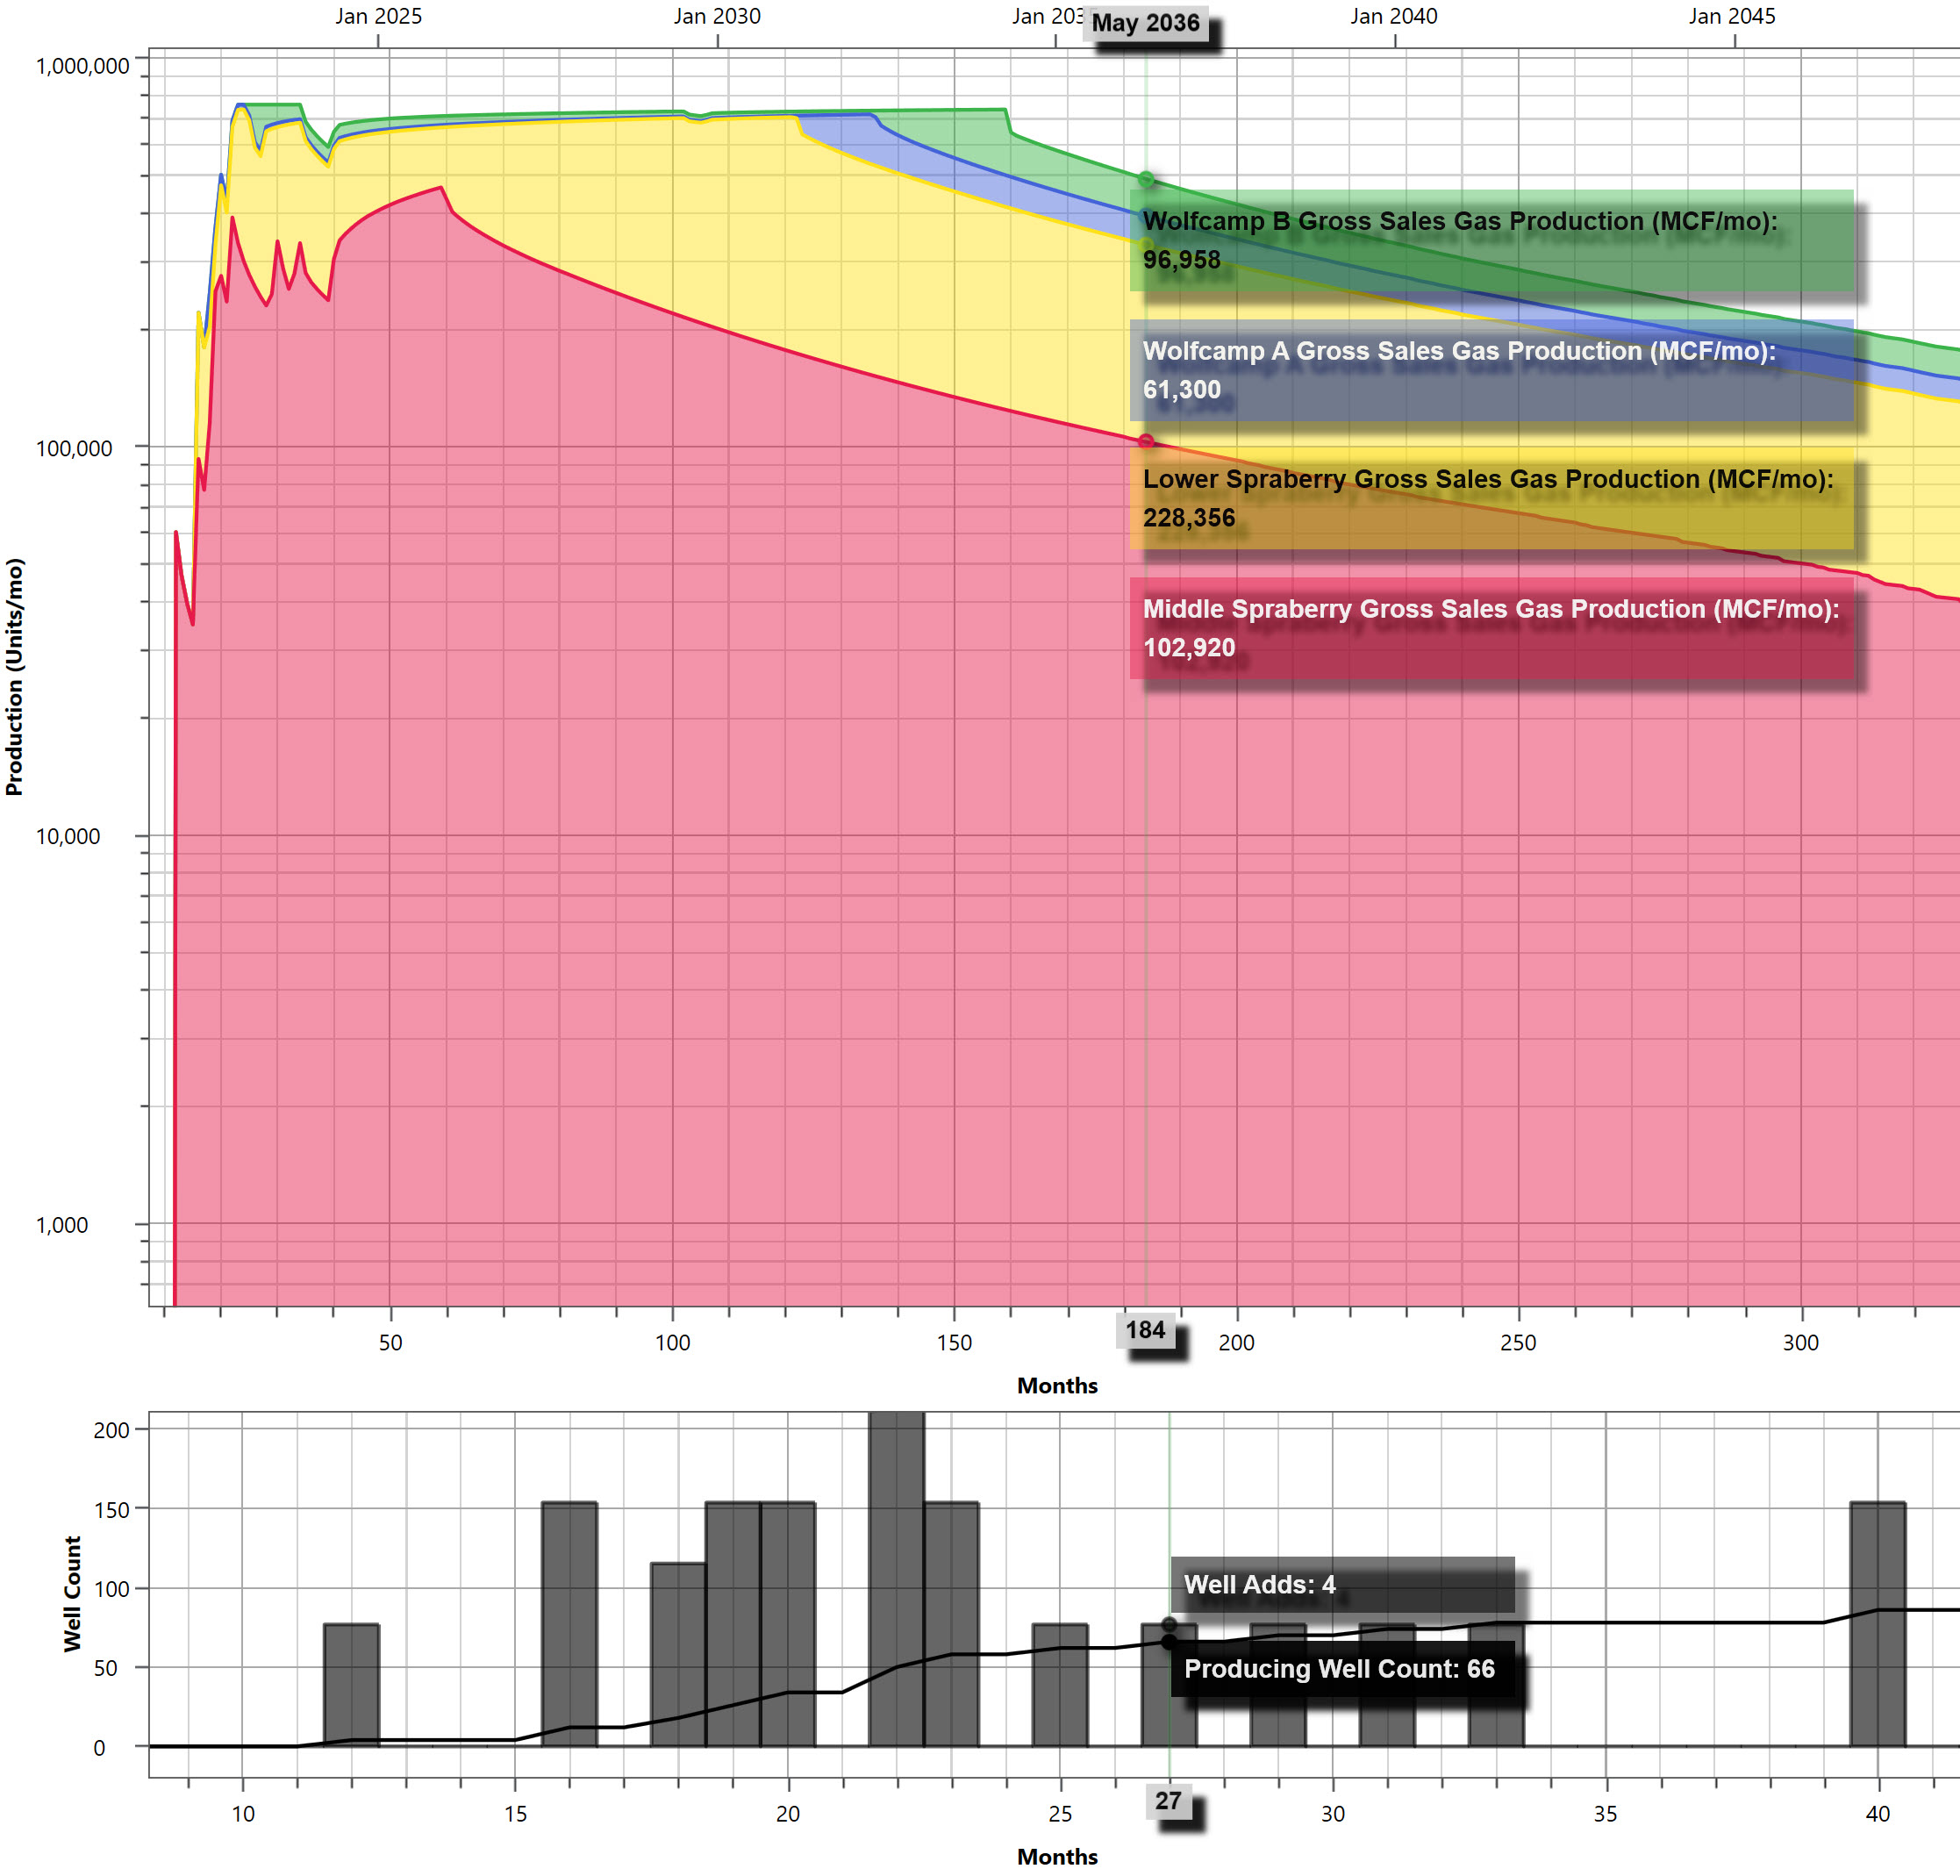
Cumulative stacked bar chart showing production contribution from four benches constrained by pipeline capacity
Asset Optimization
Drilling schedules can be optimized with respect to timing and frequency so that new wells are drilled and added to existing production based on current and future available capacity. For existing assets, base production can be included. For new development projects, ProjectRA assists project teams with optimizing project design with respect to facility capacity and schedule to maximize asset value.
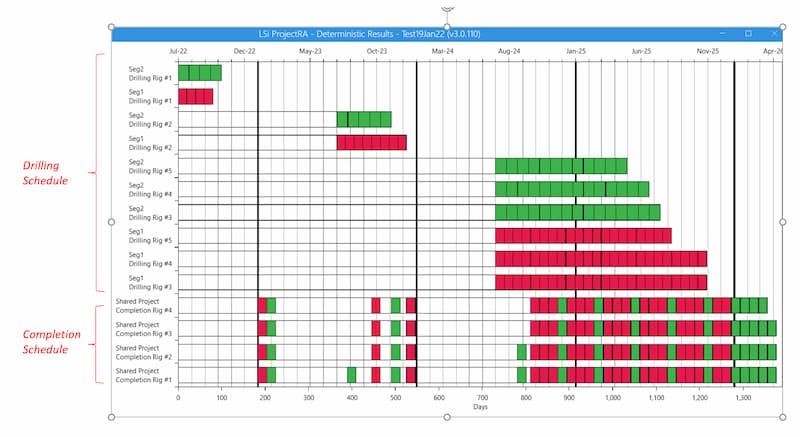
Rapidly model alternate drilling strategies to maximize value
Drilling Strategies
ProjectRA allows the evaluation of alternate drilling strategies to maximize value. Vertical drilling, horizontal drilling, completion, and production can be split into separate operations. This allows the modeling of realistic alternate strategies.
Track real-time actual project performance (dashed blue line) versus predicted
Performance Tracking
When the project is executed, actual well performance can be tracked relative to predicted using sequential aggregation. ProjectRA generates an envelope of statistical control (P90-P10 range) indicating whether the results are within the bounds assumed by the type curve. This ensures that as well results are captured, any deviation outside the expected P90-P10 envelope is identified and the forecast is re-calibrated.
Comprehensive metrics
Ready To Learn More?
Get in touch with us right away for more information about this powerful tool and to find out why ProjectRA will become an essential part of your project evaluations. To see ProjectRA firsthand, fill out our contact form for a demo or to set up a trial to test ProjectRA for yourself.
Contact Us1
01
Request a Demo
Discover the features and advantages of our software by requesting a personalized demo.
02
Open Enrollment
Our open enrollment courses offer individuals and smaller companies access to our industry-leading trainings. Courses are available worldwide throughout the year.
03
Interested in Learning More?
Please fill out our request information form to determine availability and pricing. Someone will respond within 24 hours.