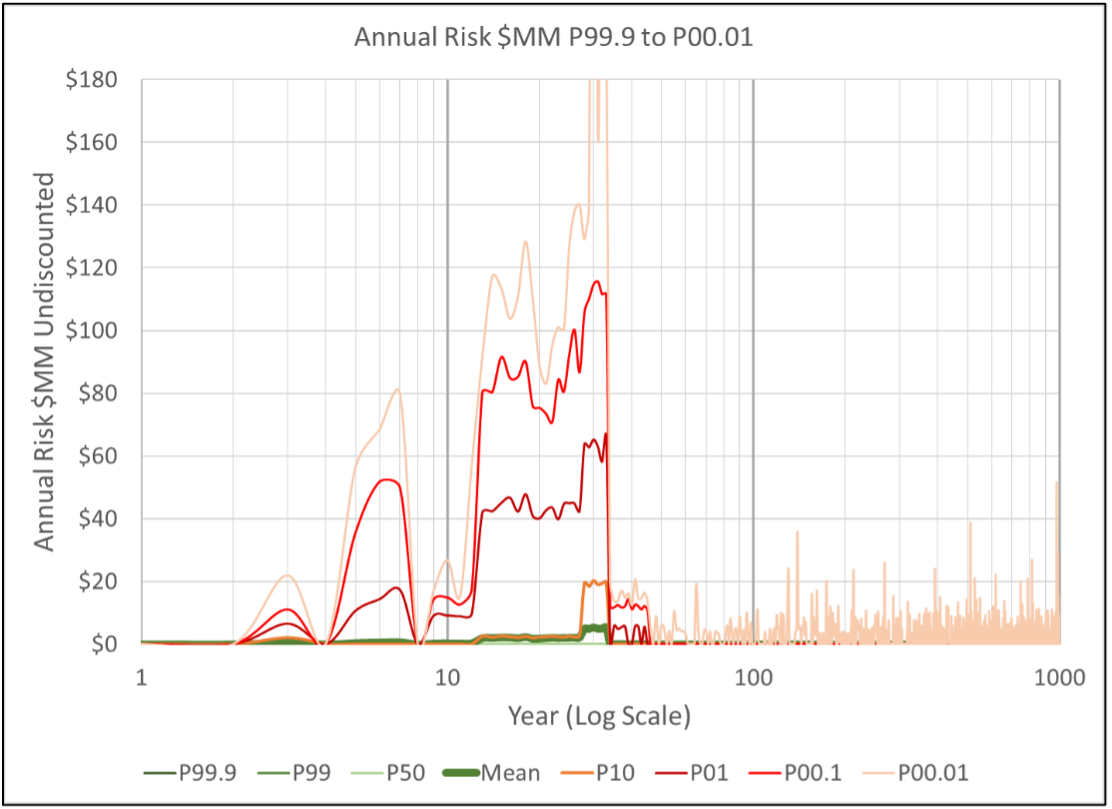
In this post we show some of the results of applying a Peak Risk workflow (discussed in the previous post) to a potential offshore CO2 storage site. The undiscounted mean annual risk of the modeled project, Illustrated by the dark green line below, shows that the annual mean risk, in dollar terms, is low throughout the life of the project. P10 risks, that have a one-in-ten chance of occurring in a given year are moderate. The chart also shows the more severe risks of events that have an annual frequency of one-in-a-hundred (P01), one-in-a-thousand (P00.1) and one-in-ten thousand (P00.01). Measurement, Monitoring and Verification (MMV) programs can be put in place to help predict the precursors of such impactful events. Note the 1:10,000 possibility of events (primarily well leakage) in the post-Injection period.
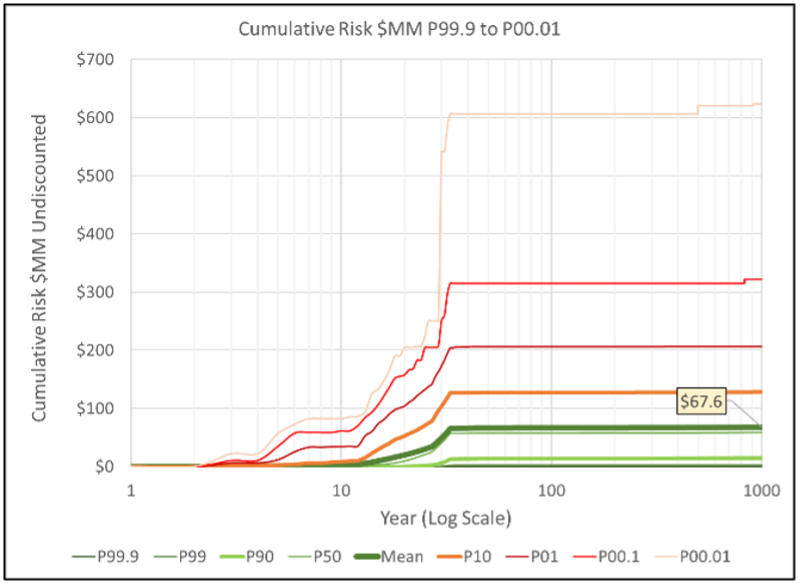
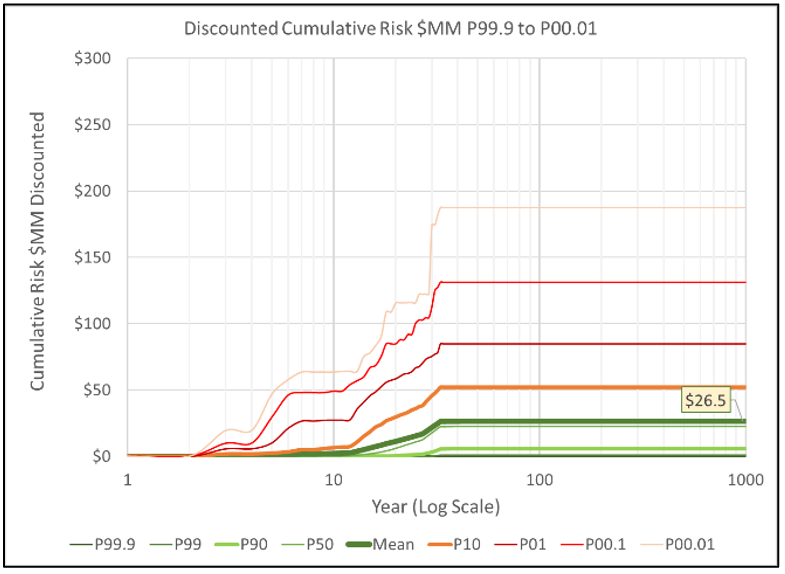
The cumulative risk of these annual data is shown below in the undiscounted and discounted (at a user defined rate of 4%) sequential aggregation charts.
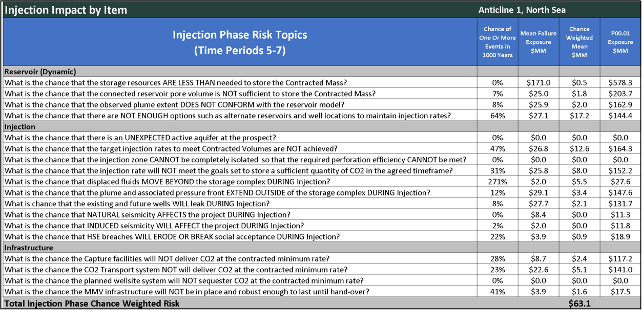
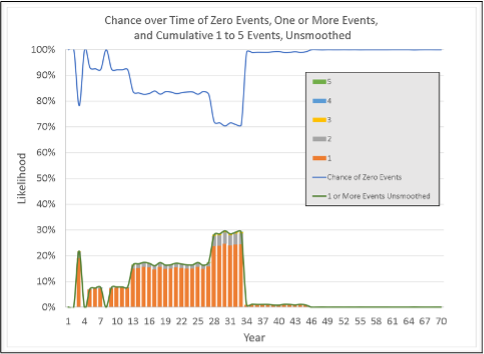
The Figure below presents the annual number of events during the injection period modeled in this example. There is a better than 70% chance that no events will occur in any of the years in this timeframe. The likelihood of one or more events reaches 30% during the late injection period, and detailed Poisson analysis indicates the chance of exactly one, exactly two and (very rarely) exactly three events in any one year.
Excellence in record keeping is an essential feature of long-term carbon sequestration projects. Our risking tool (CarbonSureRA) is designed to preserve the current assessment as well as the updates that will occur as data from the project accumulates with time. We believe it is important to record not only those events that might occur in the future, but also those events that we assess today that have no possibility of occurring (true zeros). A robust assurance process will challenge both.