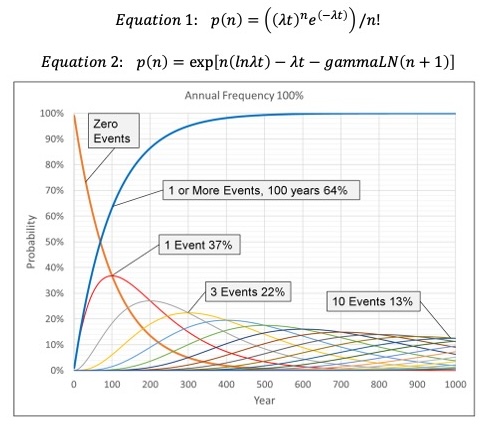
In order to quantify the potential impacts of low frequency events over time, SCS projects must consider a large number of events with variable risk profiles. Monte Carlo simulation is often used to model these events in petroleum projects, but as an alternative, the Poisson formula can be used. The formula consists of the two equations shown below:
Equation 1. The Poisson equation provides the probability of n events linked to an event rate λ and time t:
p(n) = ((λt)ne(-λt))/n!
Equation 2. Restated, the equation enables computation of the probability of n events over a 1000-year period:
p(n) = exp[n(ln λt) – λt – gammaLN(n + 1)]
The basis of the Poisson distribution is that the rate of the events is constant over the specified time interval, and that each event is independent. The Figure below presents the Poisson distribution of the probability of zero and one-or-more events over a 1,000-year period given a constant annual frequency of 1% per year. Note that as the probability of zero events decreases over time, the probability of one or more events increases. Also note that this chart contains the probability curves for 1 to 10 events over the 1,000-year period.
In SCS projects, the general model is that risk (the product of consequence and likelihood) is not constant but increases during the injection period as the reservoir pressure increases and then declines after the injection is completed. To accommodate this, the Poisson formula can be applied to the event frequencies for a discreet time interval in order to estimate the chance of zero, one or more, or exactly “N” events for that interval.
The idea that risk increases during injection leads to the concept of Peak Risk. This is a period (or periods) where risk is highest. This could be near the beginning of a project life (induced seismicity), in the middle (highest reservoir pressure) or towards the end (post-injection CO2 migration out of the storage complex). Our next post talks more about the timing and duration of Peak Risks.
As discussed in earlier posts, risk can be defined as the product of consequence and likelihood. The consequence term in this equation is a mixture of aleatory and epistemic uncertainties. The likelihood term is a random aleatory chance factor. Recall that aleatory uncertainties are inherently random and cannot be reduced by technical work. Epistemic uncertainties can be determined and refined by increasing knowledge of the physical properties of the system.
With this in mind, we recommend a two-step approach for risk assessment. In Step 1, project teams evaluate the epistemic uncertainty in the factors impacting the project. In Step 2, the teams proceed to assess the chance that the assessment is correct and that unexpected events might occur. Both sets of data and judgments should be stored separately and summarized at critical stage gates in the project so that decision-makers can be fully informed.
Linking the FEPs to impacts is important for identifying hazards, estimating their potential impact on the project, and proposing a fit-for-purpose monitoring plan for detection and mitigation. This is particularly important for gauging whether the CO2 plume and the pressure front ahead of the plume are being properly contained in the intended reservoir and area of interest.
FEP Methodology can provide a framework to conduct thorough risk assessments of SCS Projects, to inform robust monitoring plans via comprehensive event and hazard identification.
A comprehensive database published by Quintessa can be used as a starting point. It includes more than 200 generic FEPs and 20 impacts, specific to geological CO2 storage projects.
Not all the FEPs included in this database will be relevant to every project, but we can build an initial risk register with this comprehensive list and supplement with analyses of past projects. This helps ensure that important failure modes are not overlooked or prematurely discounted.
The bottom line is that building a comprehensive view of all possible FEPs is an important early step in the risk assessment process for SCS projects, prior to determining the frequency with which a given event may occur. This helps us understand and fully characterize potential hazards so that their effects may be mitigated and robust monitoring plans can be implemented.
For potential events where insufficient empirical or analog data are available, an estimate of likelihood must be made based on expert judgment and experience. Individual events are likely to have very low annual frequency rates, therefore utilizing an expanded log scale is necessary. And because these low probabilities are outside of our usual experience, it is challenging to assign them to these events.
Since this is a very subjective exercise, a risking scale supported by verbal descriptions should be agreed during the project framing phase and consistently used by the project team (see Table in post 22). When combined with a structured process such as the Delphi Method or use of an Expert Panel (as recommended in the RISQUE methodology) an internally consistent estimation of likelihood can be derived.
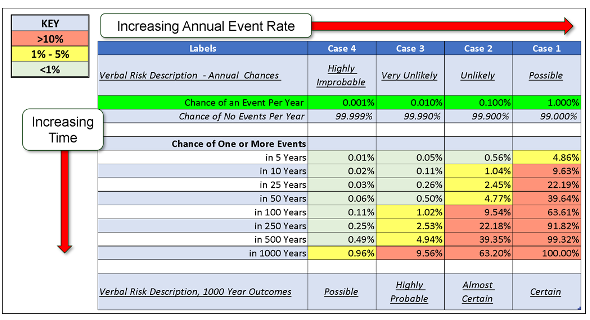
An expanded log scale (discussed in the previous post) demonstrates that the annual frequencies calculated for a single event are often very low. However, when the potential for events is evaluated over very long timeframes, the unmitigated risk of an event occurring increases (see Table below). This table, built from a series of Monte Carlo simulations, illustrates the effect of a series of constant but low frequency events. Note, for example, in Case 2 that what is unlikely on an annual basis becomes almost certain over a 1000-year period.
In SCS projects, the frequency of events will vary across the long time frames involved. Hence a process to estimate these time-varying frequencies will be presented in subsequent posts.
Quantitative risk assessment is required for SCS projects in order to fully capture their complexity, potential impacts, and monitoring requirements over long timeframes.
The subsurface characterization of potential CO2 storage sites begins with the evaluation of current risks such as pore volume and injectivity. Many SCS site selection studies have used strategies for assessing current risks that were developed in the oil and gas industry, including common risk segment mapping and the geological chance of success. These approaches typically use a probability scale of 0 to 100% (see Figure below).
The identification of future risks, such as storage effectiveness and CO2 retainment, should also begin in the early stages of a project. The frequency of these potential future events should be assessed as the probability of the event occurring in any single year. The probability values in this context are far lower than those used in oil and gas risk assessments, hence an expanded log scale is more appropriate (see Figure below).
It is possible to estimate the frequency of some types of future events using empirical data. Several papers have been published that contain data regarding the rates and annual frequencies of these events. Other analogous frequency data that could be used to estimate base rate event probabilities include seismicity data, published reports of hazards and accidents, industry and government information, and detailed reviews of SCS projects.
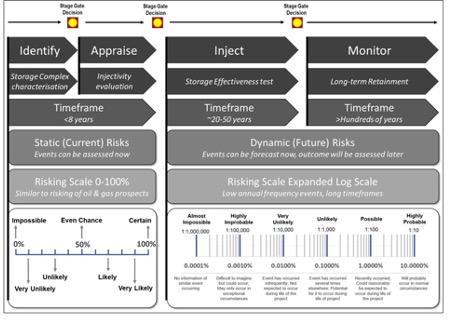
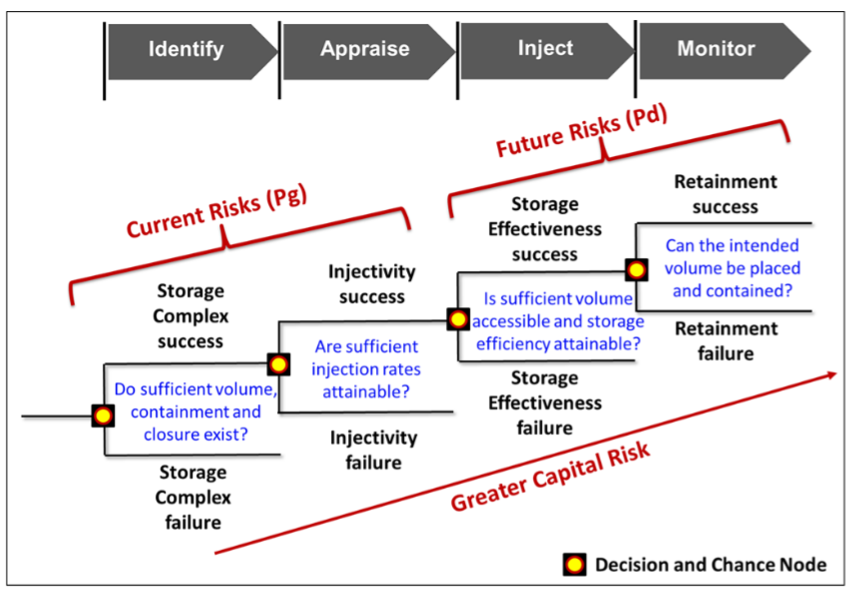
A staged approach helps identify and mitigate the subsurface risks that can impact a SCS project. Most importantly, this approach incrementally exposes capital as the project evolves so we can make good decisions about whether to continue investing. In general terms, the staged approach can be summarized in a Decision Tree (shown in the Figure below). Note that the tree contains four stages:
Our experience is that there will always be a desire to shorten or eliminate some stages. This may be possible if there is plenty of good quality subsurface data and analogs, but this decision cannot be taken lightly. Prematurely removing stages (and their stage thresholds) increases the risk of squandering large sums on failed projects.
Careful consideration of the Value of Information (VOI) is also required throughout the process. Information adds value if it affects a decision. Some of the injection projects discussed in previous postings clearly would have benefitted from a VOI exercise. For example, a thorough front-end risk assessment of the Castor project would have revealed the lack of injectivity data and the risk of induced seismicity. This could have prompted an injectivity test, revealing seismicity and avoiding the needless construction of facilities and infrastructure.
For any given project, the staged approach can be modified and coupled with a fit-for-purpose risk assessment workflow. These should be modified as the project proceeds, preferably as deliverables from an assurance process. For advice on how to implement such a process, please contact us at Rose Subsurface Assessment. We manage a Risk Coordinator’s Network consisting of 30+ companies focused on assurance best practices.
The initial subsurface risk assessment of SCS sites is similar to petroleum exploration. The focus is on quantifying the characteristics of a potential storage reservoir and the chance that it will be discovered. We classify these as current risks, which can be evaluated by drilling a well today.
Beyond these are future risks impacting whether we can store some contracted volume of CO2 over a multi-decade project life. Assessment of these risks requires the use of dynamic models calibrated to seismic surveys, injection rates, and other data. Although these models are periodically updated, they are unlikely to provide a complete and accurate view of subsurface behavior, especially beyond the timeframe for typical production operations. As such, they are insufficient for a full risk assessment.
There are multiple risk assessment techniques that have been adapted from other industries and applied to SCS projects. Many of these techniques have been published and demonstrated via case studies. However, due to the complexity, long timeframes, and uniqueness of each SCS project, no single existing published risk assessment technique will be universally suitable. Therefore, we advocate defining a robust framework that acknowledges learnings from past projects, utilizes the best combination of existing risk assessment methods for each project, and enables the understanding of project risk to evolve as the project progresses.
A key purpose for such a framework is to quantify the risk profile of a project through time, including a determination of those periods of Peak Risk when the system is close to maximum stress and the risk of an event occurring is highest. In developing such a framework, we incorporate the following elements which will be discussed in succeeding posts:
Any significant event occurring during an injection project should have been foreseen as a possibility. A thorough understanding of potential analogues, the allocation of sufficient time and tools to characterize projects, and the application of techniques to mitigate bias can help ensure this happens.
Moreover, the chance of the event occurring can be quantified through additional data gathering and analysis, and the cost of impactful eventscan be reduced by pilot projects prior to committing to a full-scale project. This requires a strategy that does not unreasonably accelerate development and minimizes expenditures.
These are not easy hurdles to overcome, and a concerted effort is needed to address them. Some of the techniques we advocate are framing sessions, a staged approach, peer reviews, external audits, and performance lookbacks. These promote a rigorous assessment of the uncertainties, which reveal the key risks, including those that are not immediately apparent.
An understanding of what unexpected events could occur, and what their impacts could be, is crucial. Failure cases should be constructed and shared with the regulator and stakeholders. The use of probabilistic techniques is highly recommended in this process for quantifying project framing, analysis, and risking.
Site-specific geological and project characteristics must guide appraisal and decisions regarding implementation. This means the burden is on the operator to quantify and mitigate risks. Failure to do so not only jeopardizes the commercial viability of the project, but can also imperil wider social license if the impact of unforeseen events negatively affects the public.
Posts 10-17 in this series contained 8 examples of underground injection projects. Each of them encountered events that impacted project results. And while some of these events were anticipated, most were not. Building on these experiences, a series of observations can be made.
Understanding the subsurface is fundamental for SCS projects, just as it is for hydrocarbon exploration. We begin with homogeneous and isotropic models, and then refine them to approximate the state of nature. In the absence of dynamic injection data, it is challenging to capture the true heterogeneity of the reservoir and its impact on CO2 plume movement (Sleipner project), especially if natural fractures are involved (In Salah project).
This has implications for how much fluid can be stored without pressuring-up the reservoir (Snøhvit project) or exceeding the fracture gradient and breaching containment (Tordis project). The thickness of permeable reservoir (Kh) is key for achieving injectivity, which can be diminished by operational problems (Gorgon project) or halted by induced seismicity if geomechanical properties are unknown (Castor project).
Once the CO2 is injected, understanding the plume size, geometry, and migration direction becomes critical. Injected fluids may impact offset accumulations (Wilmington and Huntsman projects) and pose significant liability, especially in areas where the pore space is privately owned.
These are not easy hurdles to overcome, and a concerted effort is needed to address them. We’ll summarize some of the techniques we use to address these issues in our next posting.
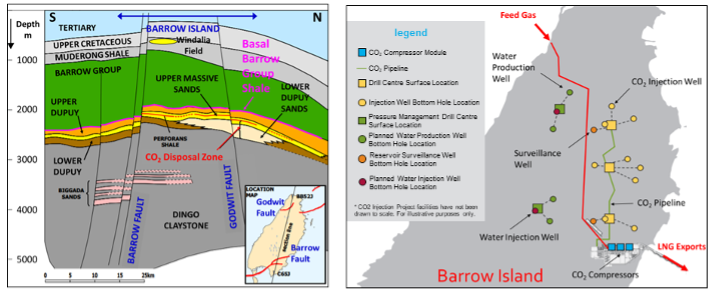
The Gorgon SCS project on Australia’s Northwest Shelf began injection in July 2020 and is one of the largest active projects, with a nominal injection capacity of 4 Mt per year. A plant on Barrow Island receives feed gas from the Gorgon and Io/Jansz Fields and separates the CO2 from natural gas.
The CO2 is then injected into sandstones of the Lower Dupuy Formation at a depth of approximately 2,500 m (See Figure below). In order to reduce pressure build-up in the storage reservoir, brine is extracted from the Lower Dupuy and reinjected into shallower sands of the Barrow Formation. Unfortunately, sand influx into the brine re-injection wells resulted in a shortfall in injected water volumes and hence, in the volumes of brine extracted from the storage reservoir.
This, in turn, increased the reservoir pressure in the Lower Dupuy, limiting CO2 injectivity and prompting the regulator to impose an injection rate limit to mitigate additional risks. Subsequently, Gorgon has not been able to meet its contractual obligations. The project had to acquire and surrender carbon credits to offset its target shortfall of 5.23 Mt of CO2 at an estimated cost in excess of US$100 million.
Gorgon is an example of a potential risk (sand influx) that was not sufficiently addressed in well planning. Additional analysis, including a possible pilot project, would have been useful in identifying the possible severity of this issue and how to best mitigate it.