This story was published in GeoEx Pro Volume 22 Issue 3. The cover story profiles Henry Pettingill and Rocky Roden. Access the PDF of the issue here.
Rose Subsurface Assessment is excited to announce Geo Risk Analysis Studio — a comprehensive suite of tools designed to evaluate subsurface risk and uncertainty across Conventional, Unconventional, and CCS projects.
Our solutions empower Oil & Gas and CCS professionals to make informed decisions by providing a full understanding into the range of potential outcomes of their projects.
Rose software tools are designed by geoscientists and engineers to be intuitive and user-friendly, enabling you to focus on what truly matters—modelling your projects—without the hassle of mastering complex software.
Key tools which have been comprehensively updated and upgraded in recent years, include:
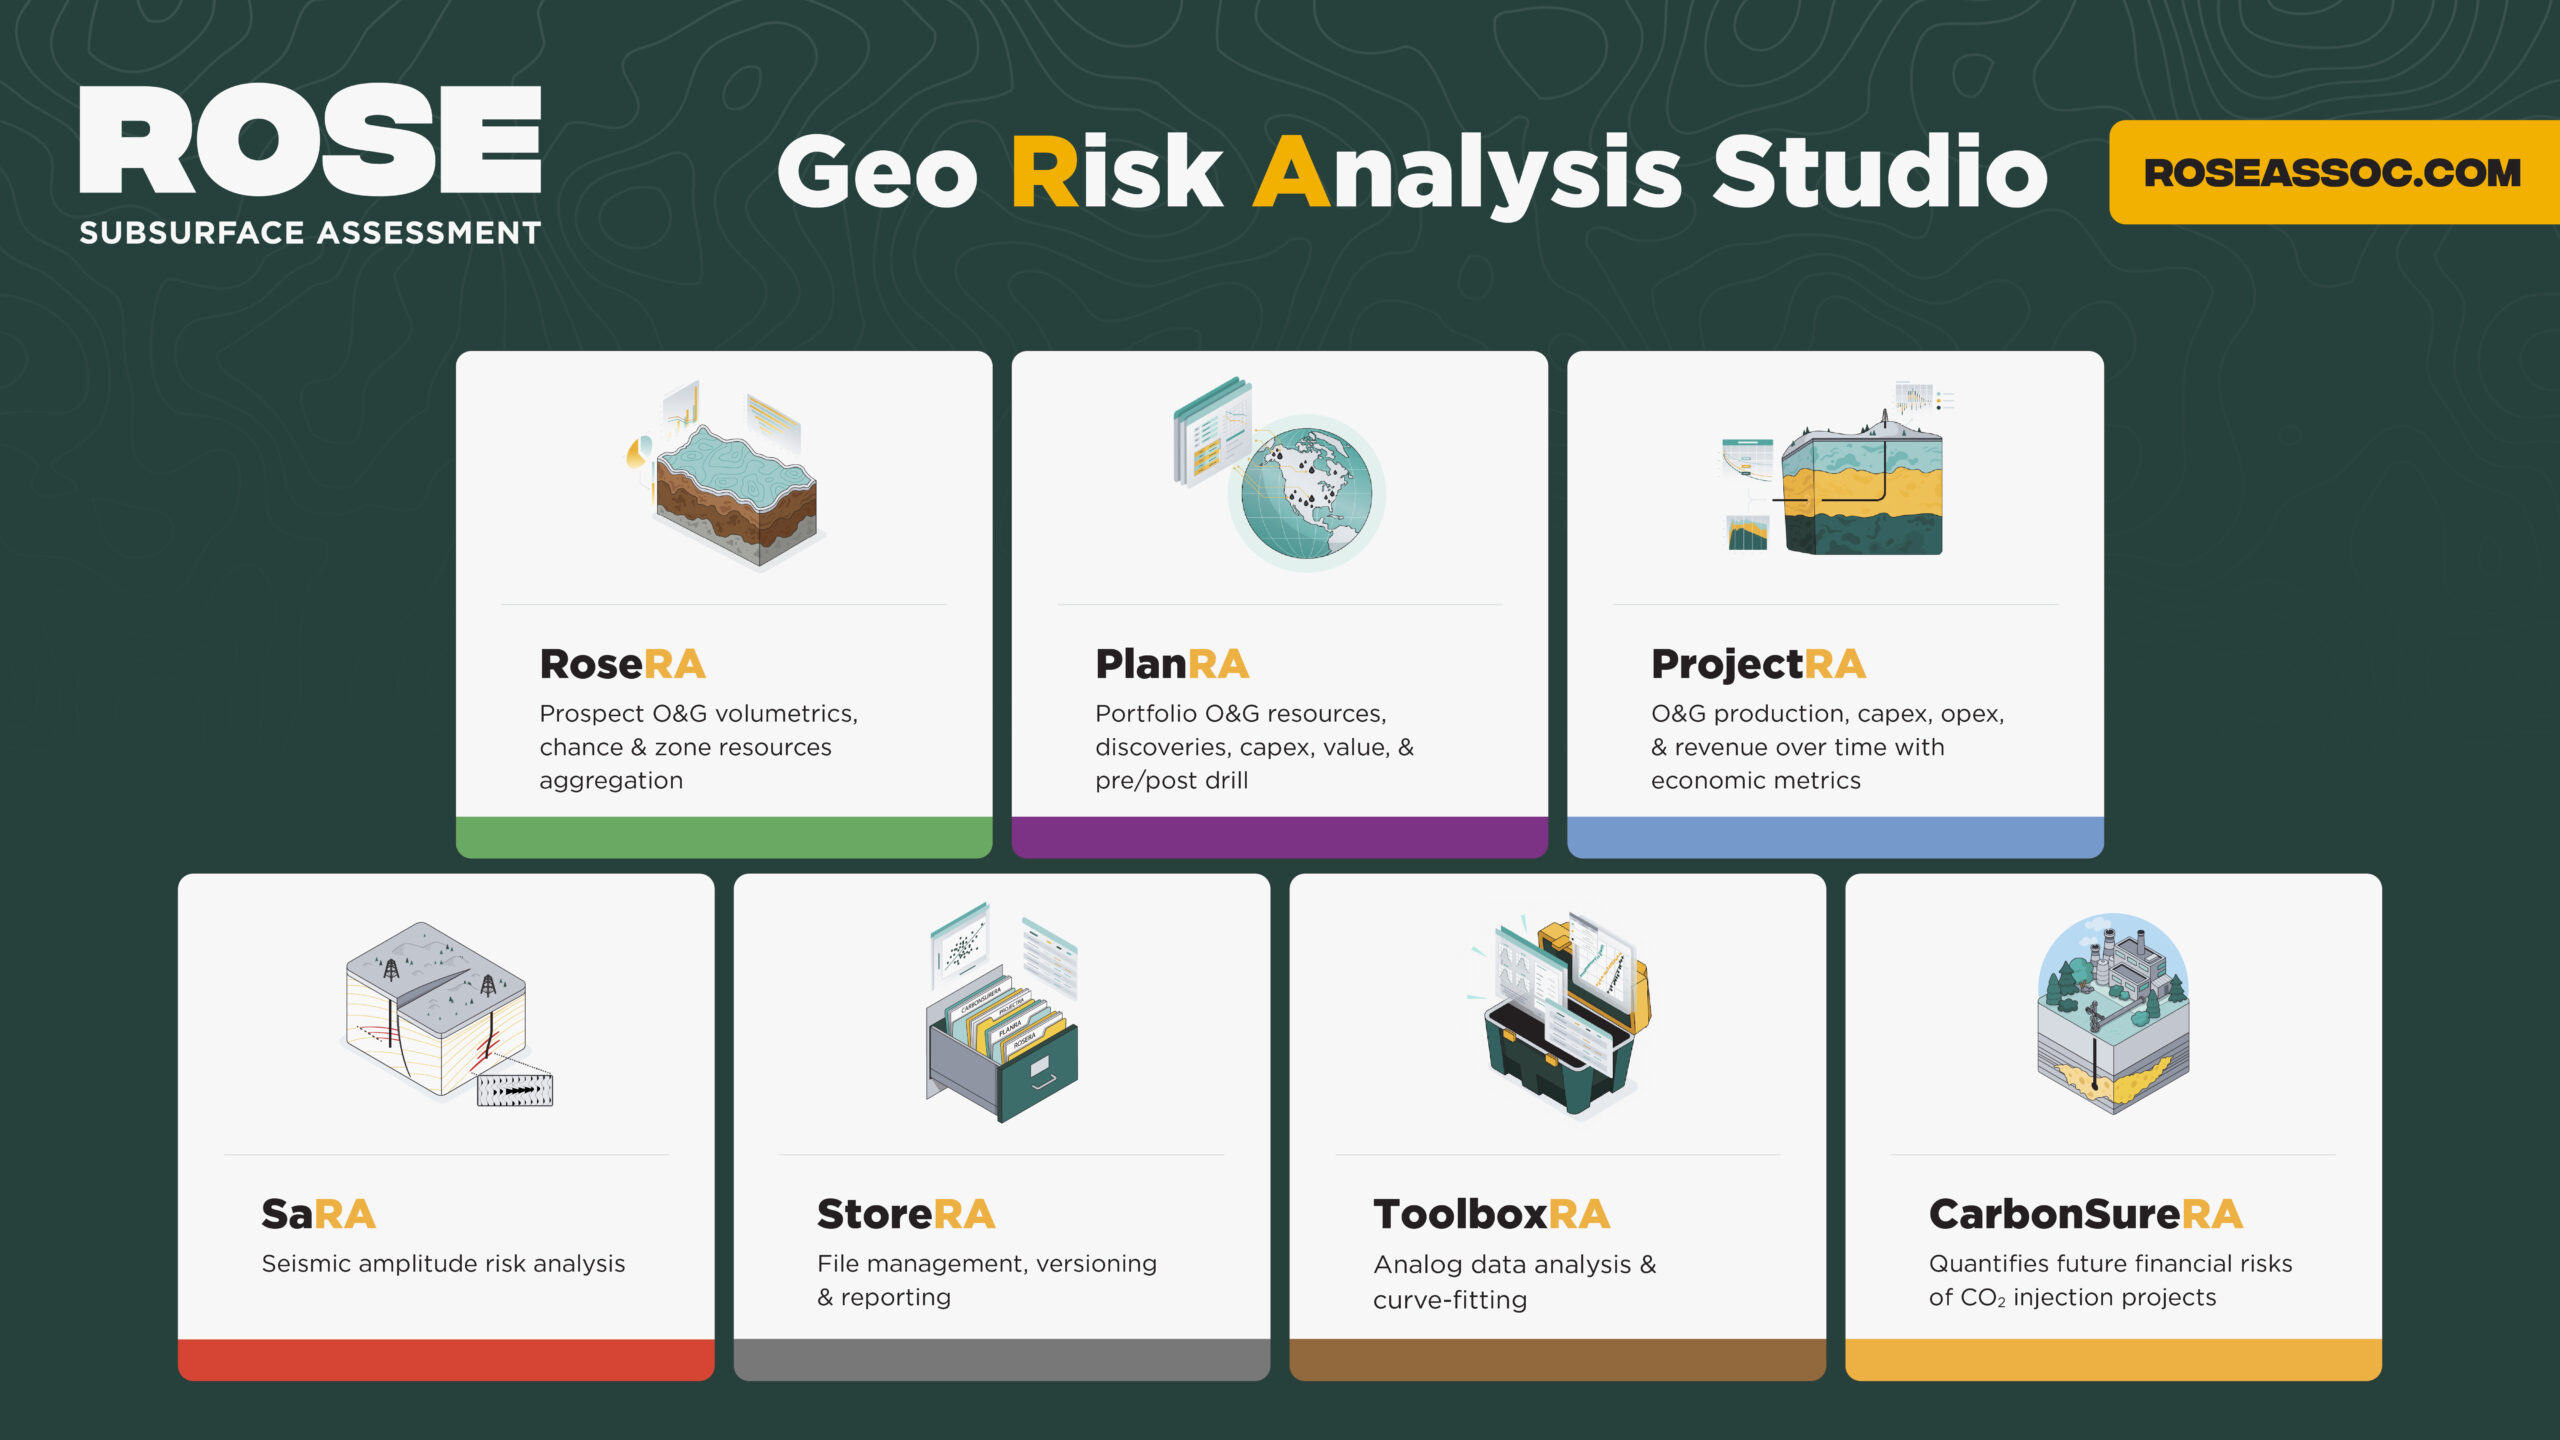
• RoseRA: Supports risk and resource assessment for conventional prospect opportunities and the storage potential of carbon projects, enabling informed and data-driven decision making.
• StoreRA: Comprehensive data management and file storage for RoseRA files, managing versions, data organization and custom reporting.
• PlanRA: this powerful Portfolio analysis tool models exploration and production program options, providing estimates of resources, commerciality, value, and costs, giving you the insights to optimize project strategies.
• ProjectRA: Models production, value, capital and cash flow over a project’s lifecycle, estimating the chance of economic success and other economic metrics to help plan for optimal development.
• CarbonSureRA: models and quantifies the long-term future financial risks of CO₂ injection projects, offering insights to help mitigate the potential for loss.
In 2025, we’ll add:
• SaRA: A tool providing a systematic workflow to risk seismic amplitudes and DHI’s, calibrated to a database of 405 drilled prospects, in order to improve pre-drill geologic risk estimates.
• ToolboxRA: analyzes large analog datasets, applying powerful curve fitting techniques to model uncertainty and generate precise inputs for stochastic tools plus some important distribution shape and handy calculators.
With Rose’s industry-leading training programs, offered globally, you’ll seamlessly integrate risk and uncertainty principles into your workflow, enhancing decision-making and driving success.
Ready to Dive In?
Over the coming weeks, we’ll be unveiling in-depth insights into each of our innovative tools and how they can revolutionize your decision-making process. Don’t miss out on the opportunity to experience these game-changing solutions firsthand.
CCS is a low-margin business. If it’s going to be successfully commercialized at scale, the costs will have to be reduced relative to what companies spend to characterize portfolios of oil and gas prospects. This may mean less subsurface data will be available, requiring professionals to apply their industry experience and use relevant analogues to fill the gaps. But it will also require more efficient and selective project development.
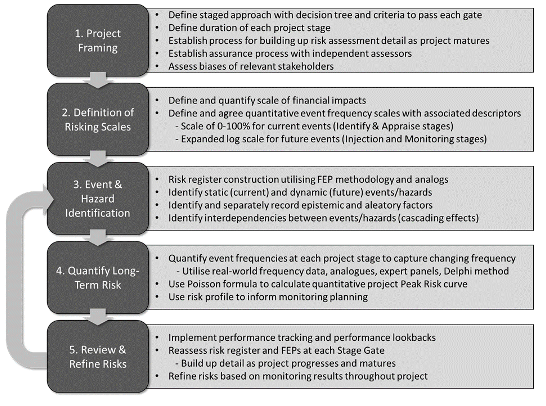
By establishing a workflow incorporating the key elements presented in the Figure below, project teams and decision makers can develop a rigorous risk assessment process that is flexible enough to evolve with a project as it matures, while ensuring critical events and hazards are identified ahead of time.
Companies must be very clear as to what can go wrong in a SCS project, the impacts that can result, and how to mitigate risks in order to obtain and maintain their social license to operate. As a nascent industry, there is a lack of understanding by the general public of what SCS is, and it is burdened by poor publicity through a strong association with oil and gas.
Tolerance for failure will be low. As the Gorgon project (discussed in Posts 2, 3 and 17) has already demonstrated, problems and failures in one project have the potential to negatively impact other projects in the eyes of stakeholders. A robust and thorough quantitative risk assessment workflow for the full lifecycle of a project is critical to demonstrate due diligence.
We at Rose Subsurface Assessment are striving to help companies become more objective, rigorous, and realistic in their expectations for SCS by fully assessing project risk and uncertainty. This includes strategies, workflows and tools such as RoseRA (storage volumes), ProjectRA (decision trees and cash flows), and CarbonSureRA (scoping and risking). If we can be of help, please don’t hesitate to contact us!
We strongly advocate an assurance process, which provides the opportunity for independent experts and decision-makers to ask questions of the CO2 storage team. Examples of the types of questions that should be asked to facilitate discussion and ensure all aspects have been considered could include the following:
Not only is it important for decision makers to be asking these sorts of questions, but also it’s important for the technical team to anticipate them and conduct their work in a way that can provide definitive answers.
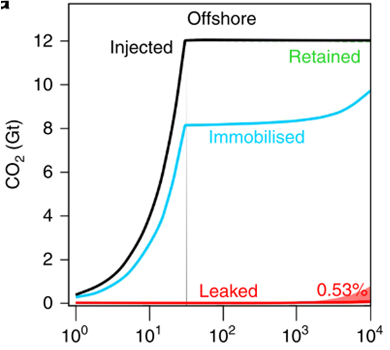
Modeling forms an essential part of the workflow across all stages of an SCS project and informs the risk assessment of multiple hazards. However, many published pre-injection model-based predictions show either minimal leakage or no failure over very long-time scales. For example, the Figure below displays results from an offshore, well-regulated model of 12 gigatons of CO2 injected into saline aquifers. The amount of leakage over a period of 10,000 years is one-half of one percent, with most of this occurring between years 1,000 and 10,000.
Subsurface models are necessarily a simplification of a complex geological system; therefore, stress-testing models is a key due diligence step. Best practice recommends that multiple subsurface models should be generated. However, due to the time and computing power needed, there is a tendency to generate a “best case” model without fully exploring the impact of parameter uncertainty on the risks.
Independent critical evaluations of storage complexes have been recently undertaken and published. For example, several critical issues were identified in the HyNet project in Liverpool Bay, United Kingdom, including the shallow top of the main reservoir, a waste zone above the main reservoir, faults that may reach the seabed and concerns about seal integrity. Independent analyses such as these should form part of a comprehensive assessment of model inputs and risks.
Running failure cases with the models will help to identify and better assess the causes of failure. An ongoing evaluation of subsurface models in conjunction with the monitoring of injection and plume migration can inform model updates and identify which model result is the closest representation of reality. It is important to stress that being objective in this modeling work is paramount, which means setting your biases and desired outcomes aside.
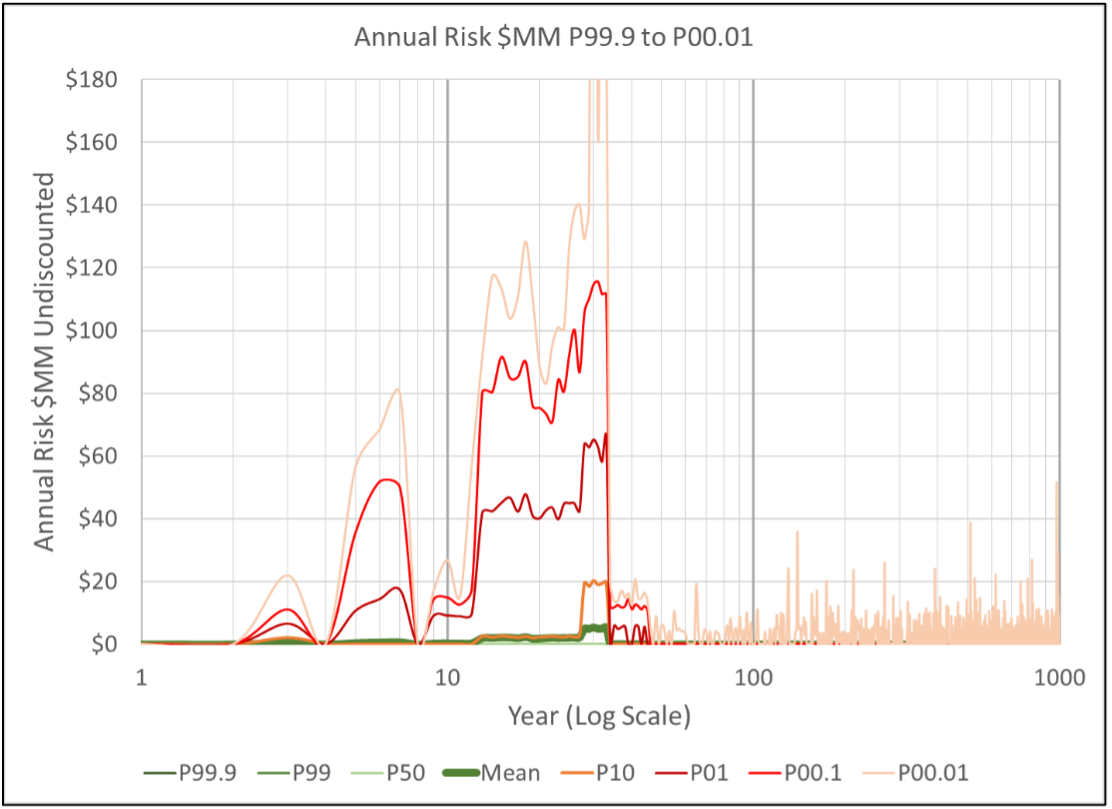
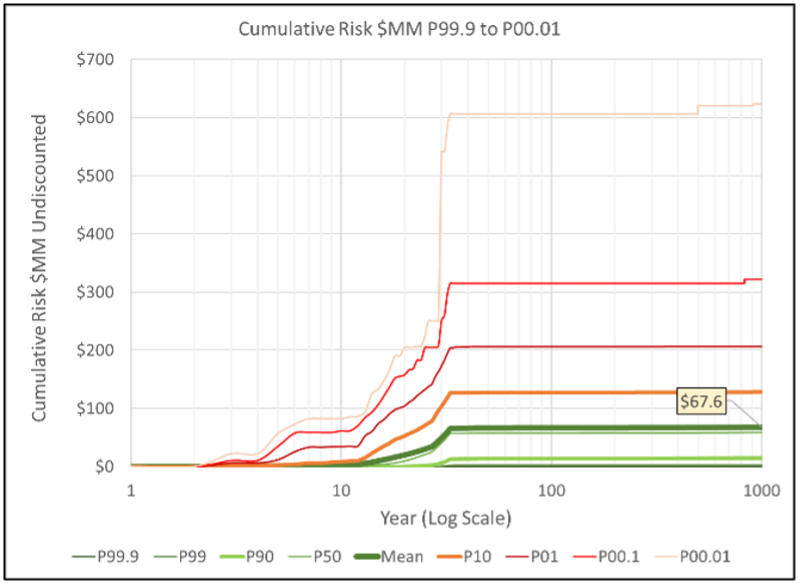
In this post we show some of the results of applying a Peak Risk workflow (discussed in the previous post) to a potential offshore CO2 storage site. The undiscounted mean annual risk of the modeled project, Illustrated by the dark green line below, shows that the annual mean risk, in dollar terms, is low throughout the life of the project. P10 risks, that have a one-in-ten chance of occurring in a given year are moderate. The chart also shows the more severe risks of events that have an annual frequency of one-in-a-hundred (P01), one-in-a-thousand (P00.1) and one-in-ten thousand (P00.01). Measurement, Monitoring and Verification (MMV) programs can be put in place to help predict the precursors of such impactful events. Note the 1:10,000 possibility of events (primarily well leakage) in the post-Injection period.
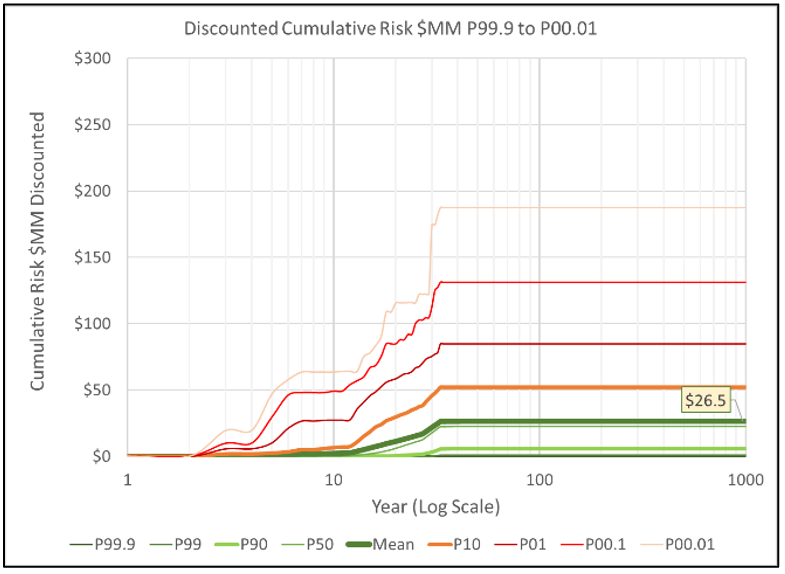
The cumulative risk of these annual data is shown below in the undiscounted and discounted (at a user defined rate of 4%) sequential aggregation charts.
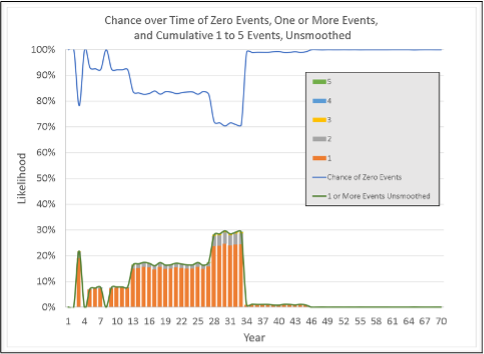
The Figure below presents the annual number of events during the injection period modeled in this example. There is a better than 70% chance that no events will occur in any of the years in this timeframe. The likelihood of one or more events reaches 30% during the late injection period, and detailed Poisson analysis indicates the chance of exactly one, exactly two and (very rarely) exactly three events in any one year.
Excellence in record keeping is an essential feature of long-term carbon sequestration projects. Our risking tool (CarbonSureRA) is designed to preserve the current assessment as well as the updates that will occur as data from the project accumulates with time. We believe it is important to record not only those events that might occur in the future, but also those events that we assess today that have no possibility of occurring (true zeros). A robust assurance process will challenge both.
What is your strategy to manage the long-term uncertainties associated with a CCS project? How will you quantify the magnitude and timing of financial risk over the project lifetime?
CarbonSureRA software empowers decision-makers by providing deep insights into financial risks associated with Carbon Capture and Storage (CCS) projects, including timing and impact of adverse events and peak risk across a project’s lifecycle.
Here’s how:
CarbonSureRA helps reduce uncertainty and drive better outcomes in CCS projects. Understand potential risk issues to better implement MMV programs and document required performance bonds. By quantifying financial risks over the long term, CarbonSureRA helps you minimize uncertainty, improve project outcomes, and make better-informed decisions in the CCS industry.
Ready to future-proof your CCS strategy? Head over here to read about CarbonSureRA.
#CarbonCapture #RiskManagement #CCS #FinancialForecasting #RiskAnalysis #UncertaintyModeling #EnergyTransition #CO2Sequestration #CarbonSequestration
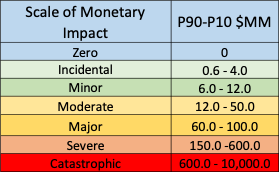
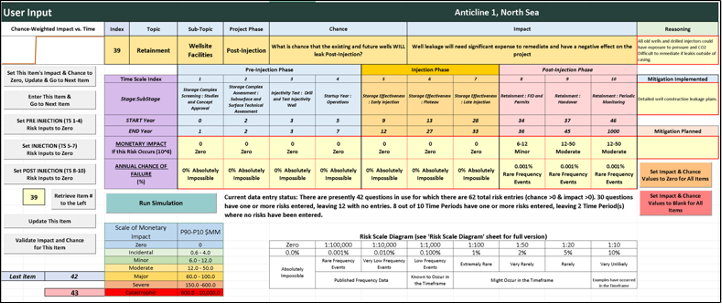
In this post, we recommend a workflow for generating an estimate of Peak Risk. The starting point is a storage complex for which the Identification stage has been completed. The data in this simplified example were derived from published information for a potential offshore CO2 storage site. The steps in the workflow are as follows:
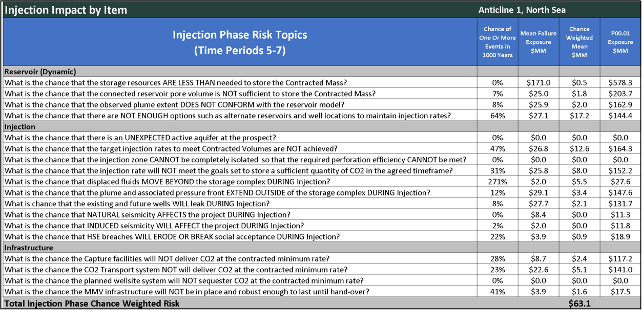
Our next post will feature the results of applying this workflow to the potential offshore CO2 storage site. The Table and Figure in this post, as well as those in the next two posts are screenshots from our CarbonSureRA tool which has been built using the workflow described herein. The P90 to P10 ranges shown are user-defined variables.
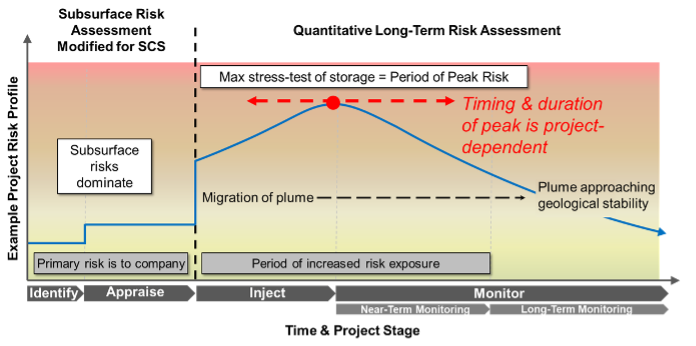
As noted in our previous post, the frequency of events, and hence the overall risk profile, will change during the life of a SCS project. The changes depend largely on the operations that are underway during each stage. This general model leads to the concept of Peak Risk depicted in the Figure below.
In the Identification stage, locations are selected that have a strong potential for safe and commercial storage. In the subsequent Appraisal stage, reservoir parameters are refined and reservoir injectivity is tested. Project risks include failing to confirm a sufficient pore volume or achieve some minimum injection rate. The impact of a failure in these two stages would be a loss of time and money limited to the participating parties.
During the Injection stage, the entire project from transport to injection, pressure management, and CO2 migration will be simultaneously tested. This is likely to create the greatest number of events and potential hazards. Project risk would likely decrease in the post-injection Monitoring stage as the plume stabilizes and becomes stationary. The impact of a failure in these two stages could impact non-participating parties via CO2 leakage, CO2 plume migration, induced seismicity, etc.
The timing and duration of any Peak Risk period depends on each specific project, so the shape and amplitude of the curve will vary. Because the time period from initial evaluation to the CO2 plume becoming geologically stable can be hundreds to thousands of years, a quantitative assessment is needed to understand the risk profile for each specific project and associated stage. Various qualitative descriptions of risk as a function of time have been published for SCS projects, but in our view are insufficient because they lack a quantitative assessment of the changing risks with time.
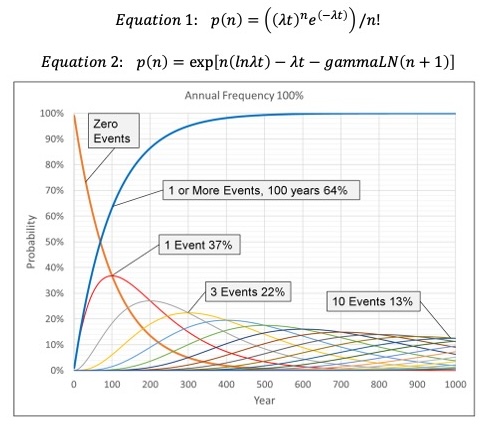
In order to quantify the potential impacts of low frequency events over time, SCS projects must consider a large number of events with variable risk profiles. Monte Carlo simulation is often used to model these events in petroleum projects, but as an alternative, the Poisson formula can be used. The formula consists of the two equations shown below:
Equation 1. The Poisson equation provides the probability of n events linked to an event rate λ and time t:
p(n) = ((λt)ne(-λt))/n!
Equation 2. Restated, the equation enables computation of the probability of n events over a 1000-year period:
p(n) = exp[n(ln λt) – λt – gammaLN(n + 1)]
The basis of the Poisson distribution is that the rate of the events is constant over the specified time interval, and that each event is independent. The Figure below presents the Poisson distribution of the probability of zero and one-or-more events over a 1,000-year period given a constant annual frequency of 1% per year. Note that as the probability of zero events decreases over time, the probability of one or more events increases. Also note that this chart contains the probability curves for 1 to 10 events over the 1,000-year period.
In SCS projects, the general model is that risk (the product of consequence and likelihood) is not constant but increases during the injection period as the reservoir pressure increases and then declines after the injection is completed. To accommodate this, the Poisson formula can be applied to the event frequencies for a discreet time interval in order to estimate the chance of zero, one or more, or exactly “N” events for that interval.
The idea that risk increases during injection leads to the concept of Peak Risk. This is a period (or periods) where risk is highest. This could be near the beginning of a project life (induced seismicity), in the middle (highest reservoir pressure) or towards the end (post-injection CO2 migration out of the storage complex). Our next post talks more about the timing and duration of Peak Risks.